OPEN-SOURCE SCRIPT
EMA Squeeze Rythm
Here's a description of this indicator and its purpose:
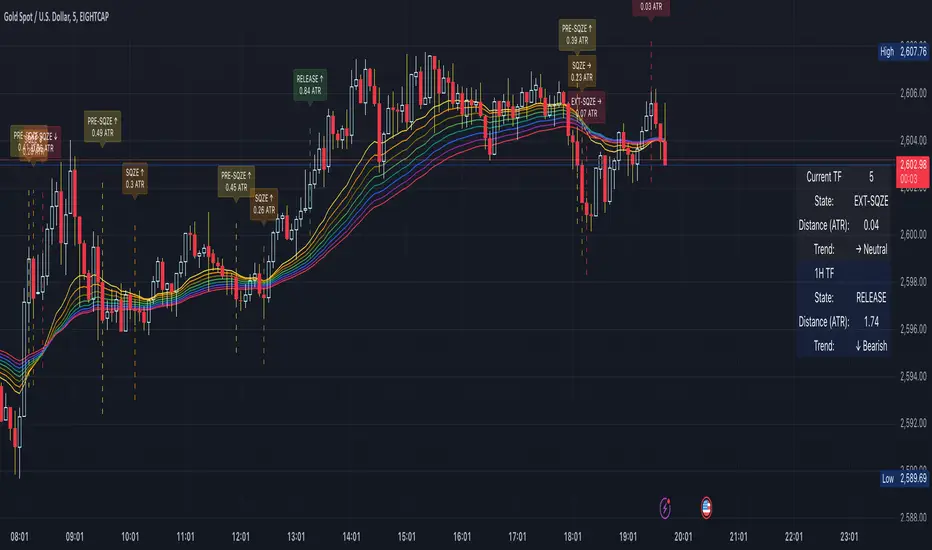
This indicator is based on the concept of price consolidation and volatility contraction using multiple Exponential Moving Averages (EMAs). It primarily looks for "squeeze" conditions where the EMAs converge, indicating potential market consolidation and subsequent breakout opportunities.
Key Features:
1. Uses 8 EMAs (20-55 period) to measure price compression
2. Measures the distance between fastest (20) and slowest (55) EMAs in ATR units
3. Identifies four distinct states:
- PRE-SQZE: Initial convergence of EMAs
- SQZE: Tighter convergence
- EXT-SQZE: Extreme convergence (highest probability of breakout)
- RELEASE: EMAs begin to expand (potential breakout in progress)
Best Used For:
- Identifying potential breakout setups
- Finding periods of low volatility before explosive moves
- Confirming trend strength using higher timeframe analysis
- Trading mean reversion strategies during squeeze states
- Catching momentum moves during release states
The indicator works well on any timeframe but is particularly effective on 15M to 4H charts for most liquid markets. It includes higher timeframe analysis to help confirm the broader market context.
Open-source script
In true TradingView spirit, the creator of this script has made it open-source, so that traders can review and verify its functionality. Kudos to the author! While you can use it for free, remember that republishing the code is subject to our House Rules.
Disclaimer
The information and publications are not meant to be, and do not constitute, financial, investment, trading, or other types of advice or recommendations supplied or endorsed by TradingView. Read more in the Terms of Use.