OPEN-SOURCE SCRIPT
RSI Distance+
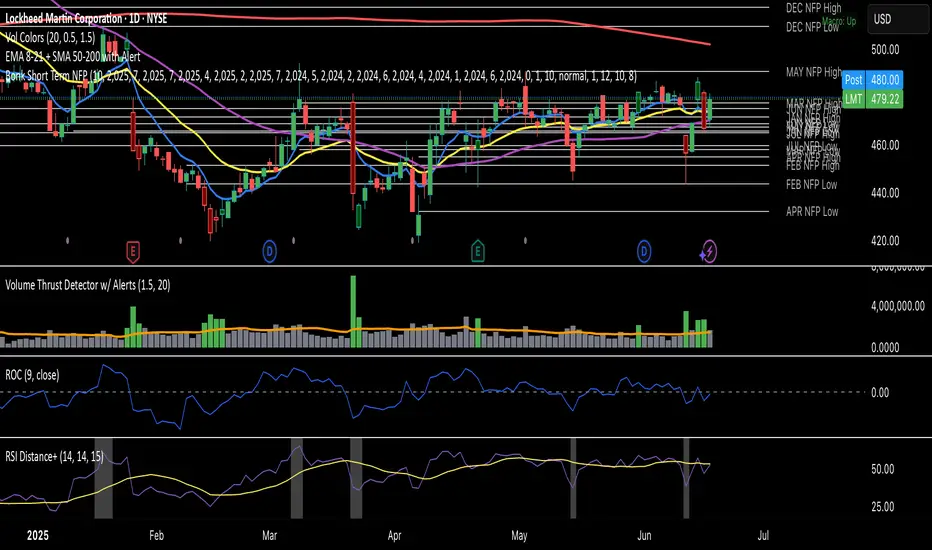
Here’s a Pine Script that highlights when the RSI line is significantly far from its moving average, just like in your marked image:
🔍 How It Works:
Calculates RSI and its SMA.
Measures absolute distance between the two.
If that distance exceeds your chosen threshold (e.g. 4.0), it:
Colors the background behind the RSI.
Marks it with a small red circle on the RSI line.
You can adjust the distanceThreshold input to fine-tune sensitivity based on your preference.
Open-source script
In true TradingView spirit, the creator of this script has made it open-source, so that traders can review and verify its functionality. Kudos to the author! While you can use it for free, remember that republishing the code is subject to our House Rules.
Disclaimer
The information and publications are not meant to be, and do not constitute, financial, investment, trading, or other types of advice or recommendations supplied or endorsed by TradingView. Read more in the Terms of Use.