OPEN-SOURCE SCRIPT
Updated wick CE; plot candle wick and tail midpoint lines
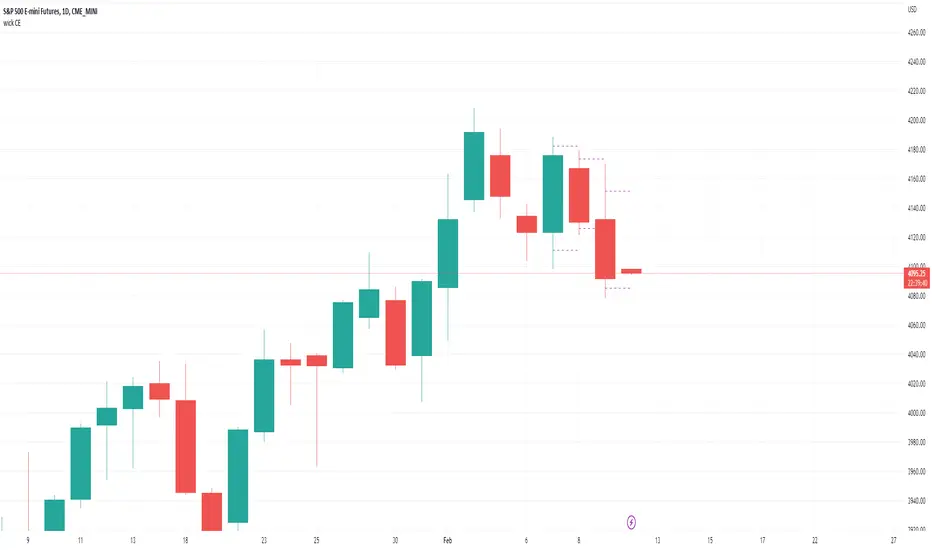
-Simple little tool to plot the wick CE: an ICT concept, consequent encroachment i.e. the midpoint line of a wick or tail; it being a potentially sensitive level (depending on context).
-Wrote this to save me time drawing out fib retracement to locate the precise level of the wick CE. Example usage: show indicator, add horizontal ray over favored wick CE level, hide indicator.
~choose how many consecutive bars back to plot wick CE lines.
~choose how many bars forward to extend the wick CE lines.
Release Notes
-increased max_bars_back and max_lines_count to allow for much larger lookbackRelease Notes
-added option to show candle body midlines too ('MT' = mean threshold)Release Notes
-added optional retracement levels (75% and 25% of high-low range); default is off.-added minimum wick size input (based on multiples of chart symbols mintick value) to filter out small wicks; (default = 1; i.e. will only filter out wick CEs where the wick is tiny or non-existent).
-added option to show chart symbol's mintick value in top right corner of chart (default off).
Release Notes
-change show current bar to default trueRelease Notes
Updated to include higher timeframe wick CE & tail CE overlayed on lower timeframe chart.Choose between realtime display and previous completed HTF display (default).
Image shows 15min chart with Daily wick CE and tail CE levels displayed.
Release Notes
corrections on screenshot above:*previous trading day
*wick/tail CE levels of previous trading day
Choose from a range of higher timeframe inputs
Open-source script
In true TradingView spirit, the creator of this script has made it open-source, so that traders can review and verify its functionality. Kudos to the author! While you can use it for free, remember that republishing the code is subject to our House Rules.
You can buy me a coffee here...
PayPal.Me/twingall
BTC: 3JrhUwNRnKyqhaa1n1AXKeAubNeEFoch6S
ETH erc20: 0x4b0400B1c18503529ab69611e82a934DDe4Ab038
ETH bep20: 0x1F0f03F184079bb1085F8C9dF3a8191C9f5869B3
PayPal.Me/twingall
BTC: 3JrhUwNRnKyqhaa1n1AXKeAubNeEFoch6S
ETH erc20: 0x4b0400B1c18503529ab69611e82a934DDe4Ab038
ETH bep20: 0x1F0f03F184079bb1085F8C9dF3a8191C9f5869B3
Disclaimer
The information and publications are not meant to be, and do not constitute, financial, investment, trading, or other types of advice or recommendations supplied or endorsed by TradingView. Read more in the Terms of Use.