OPEN-SOURCE SCRIPT
Updated Juice Levels
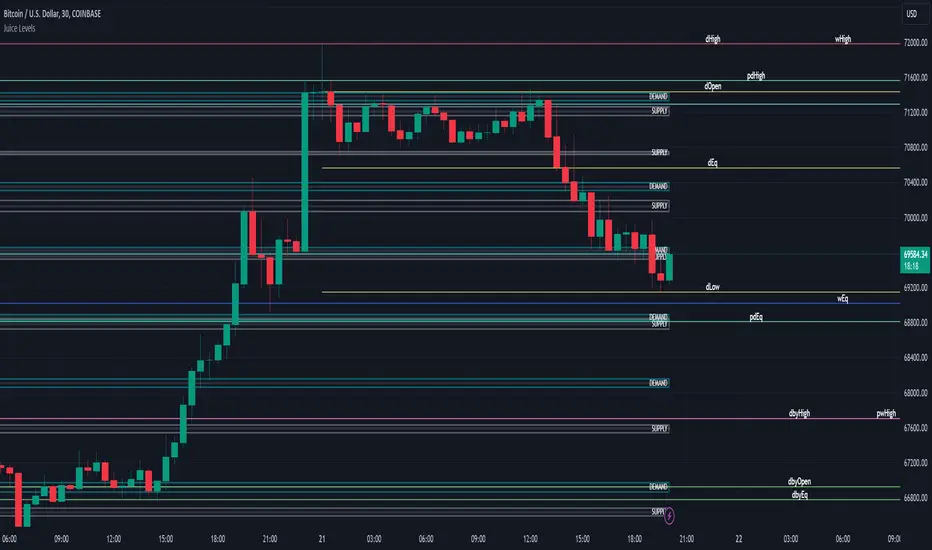
Supply and Demand Key Levels
These levels encompass key price points derived from various timeframes, providing crucial insights into market dynamics and potential trading opportunities. These levels include daily, prior day, day before yesterday, weekly, prior weekly, monthly, and prior monthly levels.
Daily, Prior Day, Day Before Yesterday Levels
Offer intraday reference points and historical context for analyzing short-term price movements.
Weekly, Prior Weekly Levels
Provide insights into longer-term trends and potential areas of price consolidation or breakout over a one-week timeframe.
Monthly, Prior Monthly Levels
Offer significant insights into macroeconomic trends and investor sentiment over longer timeframes, spanning one month.
Equilibrium Levels
Indicate points where supply and demand are relatively balanced, often serving as pivot points for price movements.
Supply and Demand Zones
Highlight areas on a price chart where significant buying or selling pressure is expected, aiding traders in identifying potential reversal or breakout zones.
These levels and zones are essential tools for traders to analyze market sentiment, identify support and resistance levels, and make informed trading decisions across various timeframes.
Release Notes
- Added options to enable / disable every line per periodOpen-source script
In true TradingView spirit, the creator of this script has made it open-source, so that traders can review and verify its functionality. Kudos to the author! While you can use it for free, remember that republishing the code is subject to our House Rules.
- Juice Signals™
Disclaimer
The information and publications are not meant to be, and do not constitute, financial, investment, trading, or other types of advice or recommendations supplied or endorsed by TradingView. Read more in the Terms of Use.
Open-source script
In true TradingView spirit, the creator of this script has made it open-source, so that traders can review and verify its functionality. Kudos to the author! While you can use it for free, remember that republishing the code is subject to our House Rules.
- Juice Signals™
Disclaimer
The information and publications are not meant to be, and do not constitute, financial, investment, trading, or other types of advice or recommendations supplied or endorsed by TradingView. Read more in the Terms of Use.