OPEN-SOURCE SCRIPT
Muti TimeFrame 1st Minute High and a Low
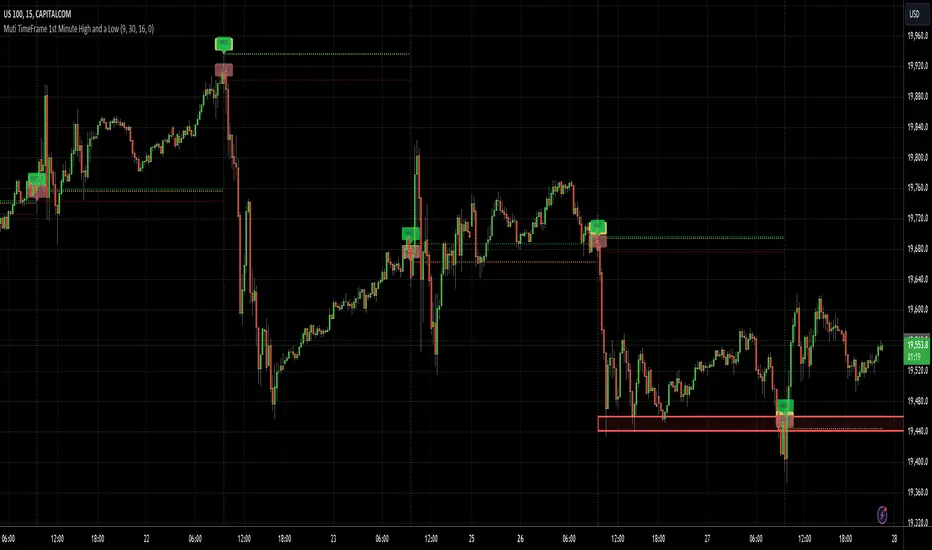
This Pine Script code is designed to plot the high, close, and low prices at exactly 9:31 AM on any timeframe chart. Here's a breakdown of what the script does:
Inputs
Define the start time of the trading day (default: 9:30 AM)
Define the end time of the trading day (default: 4:00 PM)
Toggle to display daily open and close lines (default: true)
Toggle to extend lines for daily open and close (default: false)
Calculations
- Determines if the current bar is the first bar of the trading day (9:30 AM)
- Retrieves the high, close, and low prices at 9:31 AM for the current timeframe
- Plots these prices as crosses on the chart
- Draws lines for the 4 pm close and 9:30 am open, as well as lines for the high and low of the first candle
- Calculates the start and end times for a rectangle box and draws the box on the chart if the start price high and low are set
Features
- Plots the high, close, and low prices at exactly 9:31 AM on any timeframe chart
- Displays daily open and close lines
- Extends lines for daily open and close (optional)
- Draws a rectangle box around the first candle of the day (optional)
Markets
- Designed for use on various markets, including stocks, futures, forex, and crypto
This script is useful for traders who want to visualize the prices at the start of the trading day and track the market's movement throughout the day.
Open-source script
In true TradingView spirit, the creator of this script has made it open-source, so that traders can review and verify its functionality. Kudos to the author! While you can use it for free, remember that republishing the code is subject to our House Rules.
Disclaimer
The information and publications are not meant to be, and do not constitute, financial, investment, trading, or other types of advice or recommendations supplied or endorsed by TradingView. Read more in the Terms of Use.