OPEN-SOURCE SCRIPT
Updated Stochastic MACD
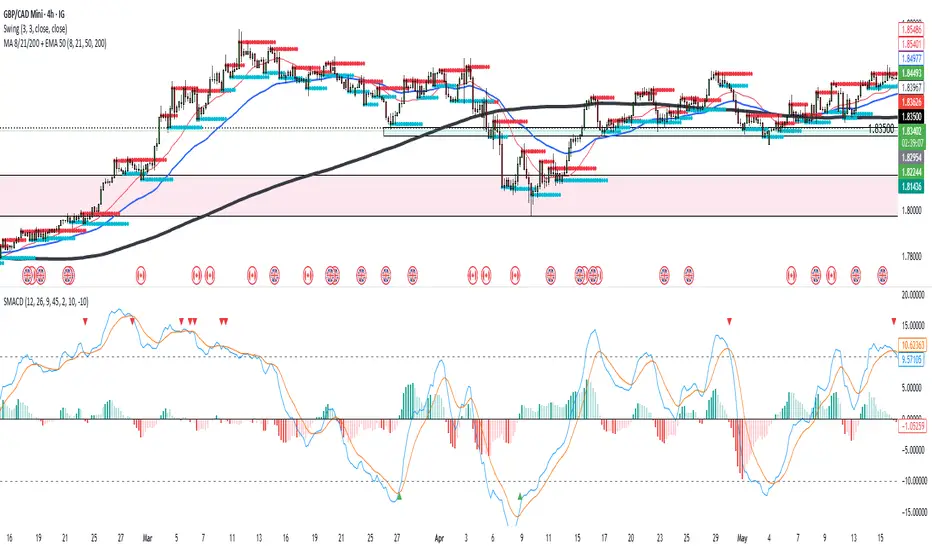
Stochastic MACD Indicator: Quick Guide
This Pine Script indicator, "Stochastic MACD" (SMACD), blends MACD and Stochastic Oscillator principles to help you spot momentum shifts and potential reversals.
What it Shows:
SMACD Line: Tracks momentum.
Signal Line: Averages the SMACD line, creating crossovers.
Histogram: Visualizes momentum strength, changing color with direction.
Overbought/Oversold Levels: (Default 10 and -10) Help identify stretched market conditions. Adjustable in settings.
Visual Signals (Triangles):
Red Down Arrow (Overbought Signal): Appears when both SMACD and Signal lines are above the Overbought level (default 10) AND SMACD crosses the Signal line upwards. This suggests strong overbought conditions and a potential reversal down.
Green Up Arrow (Oversold Signal): Appears when both SMACD and Signal lines are below the Oversold level (default -10) AND SMACD crosses the Signal line upwards. This suggests potential buying opportunities from oversold conditions and a possible reversal up.
How to Use It:
Confirm Trends: Use the histogram and line directions.
Spot Reversals: Look for the red and green triangles for quick alerts.
Combine: Always use with other analysis like price action or support/resistance.
Important: This is an analytical tool, not financial advice. Trading involves risk.
Release Notes
What it Shows: SMACD Line: Tracks momentum.
Signal Line: Averages the SMACD line, creating crossovers.
Histogram: Visualizes momentum strength, changing color with direction.
Overbought/Oversold Levels: (Default 10 and -10) Help identify stretched market conditions. Adjustable in settings.
Visual Signals (Triangles):
Red Down Arrow (Overbought Signal): Appears when both SMACD and Signal lines are above the Overbought level (default 10) AND SMACD crosses the Signal line upwards. This suggests strong overbought conditions and a potential reversal down.
Green Up Arrow (Oversold Signal): Appears when both SMACD and Signal lines are below the Oversold level (default -10) AND SMACD crosses the Signal line upwards. This suggests potential buying opportunities from oversold conditions and a possible reversal up.
How to Use It:
Confirm Trends: Use the histogram and line directions.
Spot Reversals: Look for the red and green triangles for quick alerts.
Combine: Always use with other analysis like price action or support/resistance.
Important: This is an analytical tool, not financial advice. Trading involves risk.
Open-source script
In true TradingView spirit, the creator of this script has made it open-source, so that traders can review and verify its functionality. Kudos to the author! While you can use it for free, remember that republishing the code is subject to our House Rules.
Disclaimer
The information and publications are not meant to be, and do not constitute, financial, investment, trading, or other types of advice or recommendations supplied or endorsed by TradingView. Read more in the Terms of Use.