OPEN-SOURCE SCRIPT
Updated Volume Delta with PVSRA
Volume Delta with PVSRA
Volume Delta with PVSRA is an advanced volume indicator that dissects each bar’s volume into its directional components using higher resolution data. It visually distinguishes between buying and selling volume, so that for a bullish candle the bottom portion represents buying volume and for a bearish candle it represents selling volume. A dot is plotted at the 50% mark of the candle’s total volume, serving as a clear reference point.
Key Features:
Directional Volume Breakdown:
The indicator calculates the delta volume by analyzing lower timeframe data. The bottom portion of a bullish candle (displayed in green) represents buying volume, while that of a bearish candle (displayed in red) represents selling volume.
PVSRA Analysis:
Using Price-Volume Spread Range Analysis, the indicator compares the current volume to the 10-bar average. When volume is significantly higher (using thresholds of 150% and 200%), the candle borders are highlighted in custom colors, indicating medium or strong volume conditions.
Volume Moving Averages:
Three moving averages are plotted:
Total Volume MA (yellow): Tracks overall volume.
Buying Volume MA (green) and Selling Volume MA (red): These are re-centered around the total volume MA. A crossover of the green over the red typically signals rising buying pressure, while the opposite indicates increasing selling pressure.
Scalable Volume Bars:
The indicator scales the volume bars to provide optimal visualization on your chart.
Setup Instructions:
For best results, open your chart settings, navigate to the Canvas tab, and set the bottom margin to 0%. This ensures the indicator displays like a standard volume indicator without any unwanted gaps at the bottom.
Customize the various settings—including colors, border opacity, and moving average parameters—to suit your trading style.
Release Notes
This updated version builds on the original Volume Delta with PVSRA by adding new ways to track extreme volume imbalances and dominant volume shifts, while keeping the core directional delta structure intact.Directional Volume Breakdown
Volume is broken down into buying and selling based on lower timeframe data using intrabar price movement. Bullish volume bars show buying volume, bearish candles show selling volume. The size of each volume bar automatically scales based on chart space for better visibility across any timeframe.
PVSRA Volume Classification
The PVSRA logic remains based on comparing current volume to its recent average. When total volume reaches 150% of the 10-bar average, candles change to medium threshold colors. When volume exceeds 200% of the average (or shows an extreme spread vs recent bars), candles are colored with high threshold colors. This helps highlight areas where stronger participation enters the market.
Dominant Volume Moving Averages
Separate moving averages for total, buying, and selling volume are plotted, with buying and selling MAs centered around the total volume average to better show shifts in directional bias. The moving averages can be customized using multiple MA types (SMA, EMA, WMA, HMA, VWMA, VMA).
Extreme Delta Percentage Markers
An additional system tracks when either buying or selling volume becomes extremely dominant relative to recent averages. This calculates the percentage of volume made up by one side, and compares it against an average of prior bars. When the percentage exceeds the threshold, a marker is plotted. This helps highlight spots where one side of the market is taking control beyond normal levels.
Mismatch Markers
Optional markers display when these extreme volume events occur in the opposite direction of the candle type. This can help identify areas where aggressive participation occurs counter to the candle close.
Volume Smoothing Option
Optional smoothing allows you to average volume calculations across multiple candles to help reduce noise on faster charts while keeping the directional structure intact.
Timeframe Handling
The indicator automatically selects the correct lower timeframe resolution for delta calculations depending on the chart timeframe. It supports second-based charts (if available) as well as higher timeframes. If lower timeframe data isn’t available, it falls back to a simplified calculation.
Customization
All settings including thresholds, averages, smoothing, coloring, opacity, and volume source selection can be fully customized.
Setup Notes
For best display, set your TradingView canvas bottom margin to 0% so the volume pane sits cleanly against the bottom of the screen.
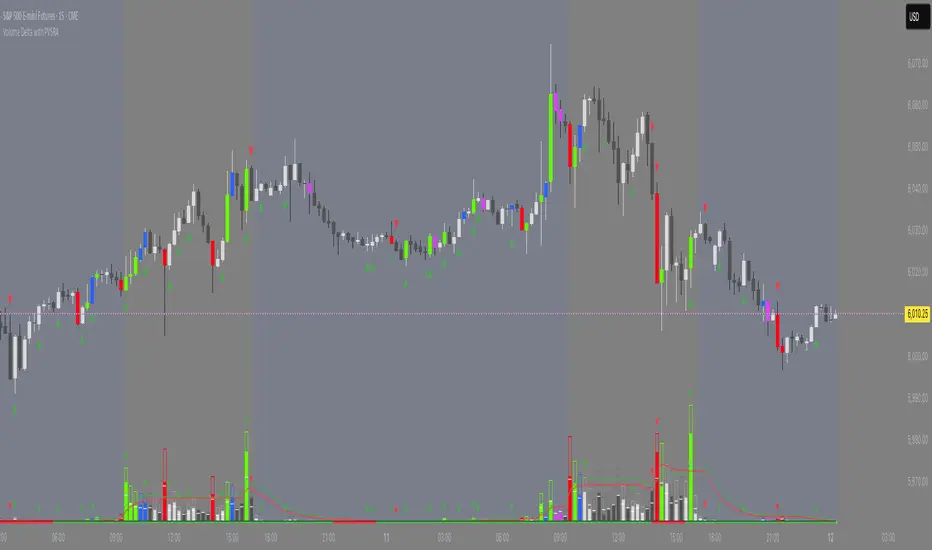
Chart Example
The screenshot shows how extreme delta volume started stacking up as volume flipped into stronger buying. The dominant volume moving averages flipped early, followed by clusters of high PVSRA candles. The extreme delta markers help visualize where buying strength continued to build ahead of the breakout.
Open-source script
In true TradingView spirit, the creator of this script has made it open-source, so that traders can review and verify its functionality. Kudos to the author! While you can use it for free, remember that republishing the code is subject to our House Rules.
Disclaimer
The information and publications are not meant to be, and do not constitute, financial, investment, trading, or other types of advice or recommendations supplied or endorsed by TradingView. Read more in the Terms of Use.