OPEN-SOURCE SCRIPT
Crypto Cycle Projection
📈 Crypto Cycle Projection – Indicator Description
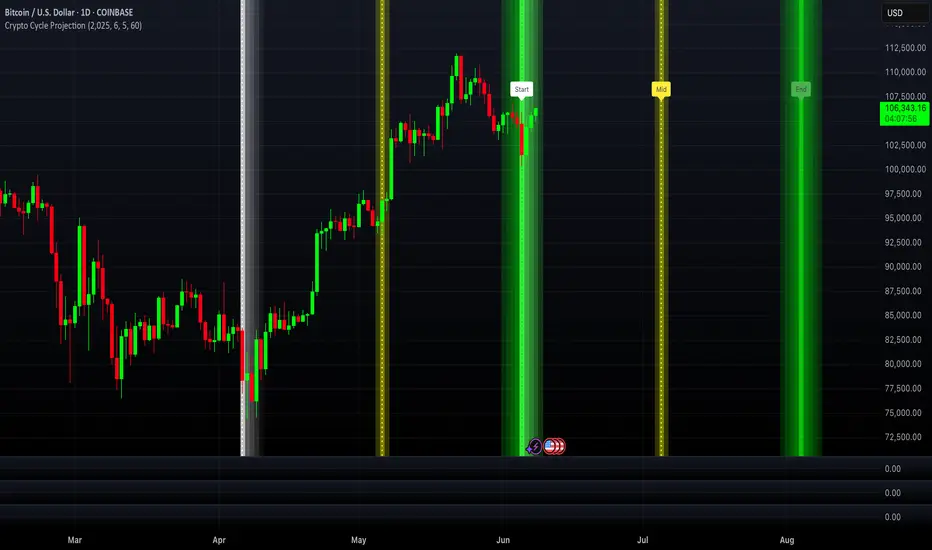
This indicator is designed to visually track and forecast repeating price cycles in the crypto market. It highlights a defined time-based cycle starting from a chosen date or the latest bar on the chart. By identifying cycle Start, Midpoint, and End zones, traders can gain insights into timing-based market structure and possible pivot periods.
⚙️ User Settings Explained
Start Point
Start from Last Candle (useLastCandle) – When enabled, the cycle begins from the most recent candle on the chart.
Manual Date (Year / Month / Day) – If Start from Last Candle is disabled, you can manually set a specific start date for the cycle.
Display Options
- Show Projection (showZone) – Toggles the display of the main cycle projection.
- Show Outer Bars (showOuter) – Adds faded edge bars around the key cycle zones for better visual emphasis.
- Show Previous Cycle (showPreviousCycle) – Adds the prior cycle to the chart, going one full cycle period back from the main start point.
Show Next Cycle (showNextCycle) – Projects one additional cycle forward beyond the current.
Cycle Parameters
Cycle Period (cyclePeriod) – Defines the number of bars in a full cycle (e.g., 60 = 60 bars). This sets the spacing between Start → Midpoint → End.
Each cycle section is color-coded:
Start = White
Midpoint = Yellow
End = Green
These reference lines and zones help you align trades with cycle timing for potential reversals, continuations, or volatility expansions.
Co-author Credit:
Matthew Hyland ParabolicMatt
Open-source script
In true TradingView spirit, the creator of this script has made it open-source, so that traders can review and verify its functionality. Kudos to the author! While you can use it for free, remember that republishing the code is subject to our House Rules.
Disclaimer
The information and publications are not meant to be, and do not constitute, financial, investment, trading, or other types of advice or recommendations supplied or endorsed by TradingView. Read more in the Terms of Use.