Megalodon Pro Automated Shorter Term Trader
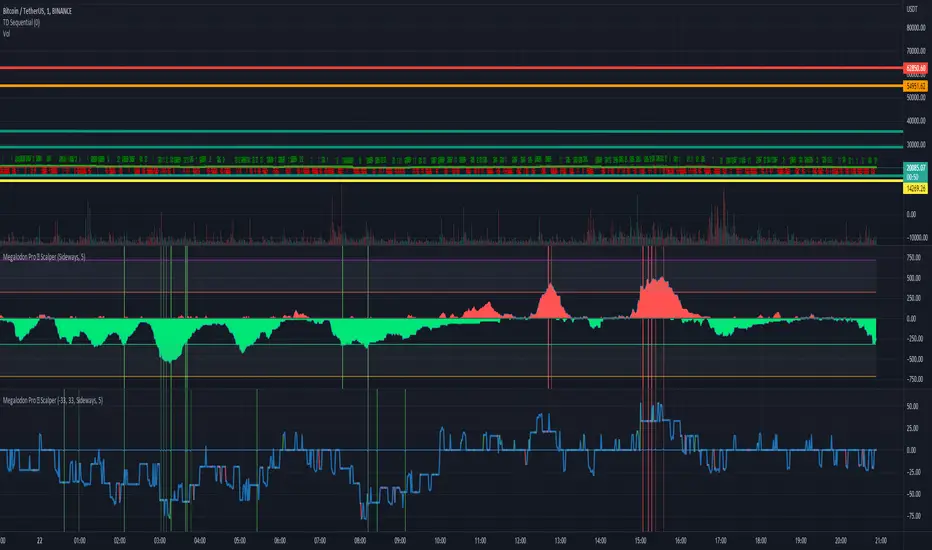
- Green cloud shows the total buy signals. Red cloud shows the total sell signals.
- Yellow line shows the difference between buy and sell signals. If yellow line is above 0, we have more SELL signals than BUY signals. If yellow line is below 0, we have more BUY signals than SELL signals.
- You should basically compare the red cloud with the green cloud to enter or exit in a trade.
- It should be used on shorter time frames. I recommend using 1 minute or 15 minute for better analysis.
- It prints Green for Buy - Orange for Strong Buy- Red for Sell - Purple for Strong Sell signals.
- This indicator basically looks for many different indicators' setups and shows you exactly what you need to know.
- You may also set alarms for 4 different signals including Buy - Strong Buy - Strong Sell - Sell
Invite-only script
Only users approved by the author can access this script. You'll need to request and get permission to use it. This is typically granted after payment. For more details, follow the author's instructions below or contact MegalodonTrading directly.
TradingView does NOT recommend paying for or using a script unless you fully trust its author and understand how it works. You may also find free, open-source alternatives in our community scripts.
Author's instructions
Warning: please read our guide for invite-only scripts before requesting access.
Disclaimer
Invite-only script
Only users approved by the author can access this script. You'll need to request and get permission to use it. This is typically granted after payment. For more details, follow the author's instructions below or contact MegalodonTrading directly.
TradingView does NOT recommend paying for or using a script unless you fully trust its author and understand how it works. You may also find free, open-source alternatives in our community scripts.
Author's instructions
Warning: please read our guide for invite-only scripts before requesting access.