OPEN-SOURCE SCRIPT
Updated Relative Strength Price Oscillator Indicator (RS PPO)
Percentage Price Oscillator (PPO)
The Percentage Price Oscillator (PPO) is a momentum oscillator that measures the difference between two moving averages as a percentage of the larger moving average. As with its cousin, MACD, the Percentage Price Oscillator is shown with a signal line, a histogram and a centerline. Signals are generated with signal line crossovers, centerline crossovers, and divergences.
PPO readings are not subject to the price level of the security and the PPO values for different securities can be compared, regardless of the price of the security.
Relative Strength (RS)
Relative strength is a strategy used in momentum investing and focuses on investing in stocks or other securities that have performed well relative to the market as a whole or to a relevant benchmark.
Chart
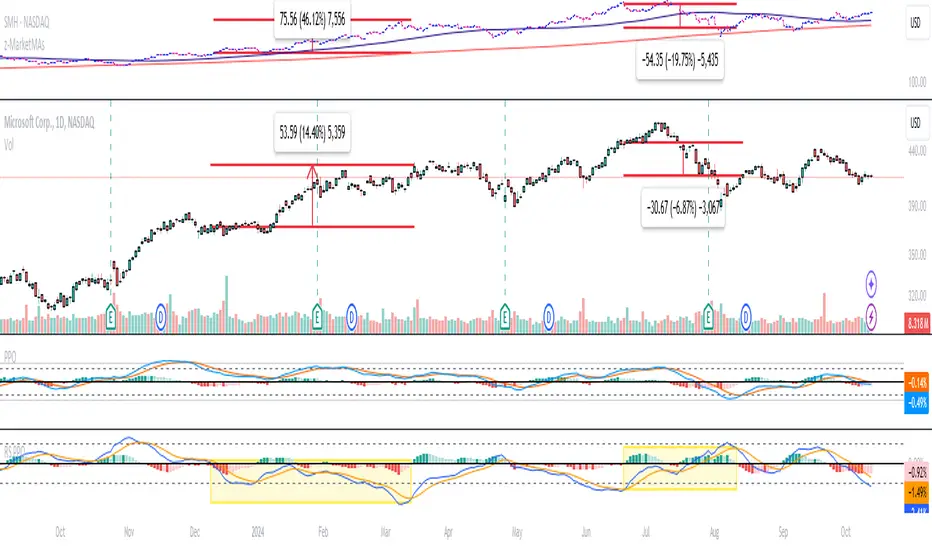
In the chart, Microsoft stock (MSFT) is plotted against the VanEck Semiconductor ETF (SMH).
In the example on the left, from the negative values of the RS PPO it can be seen that MSFT, although trending upward, is losing out in negative terms to the SMH etf.
In the example on the right, during a correction phase with a downward price trend, Microsoft held up relatively well compared to the Van Eck Semiconductor etf.
The Percentage Price Oscillator (PPO) is a momentum oscillator that measures the difference between two moving averages as a percentage of the larger moving average. As with its cousin, MACD, the Percentage Price Oscillator is shown with a signal line, a histogram and a centerline. Signals are generated with signal line crossovers, centerline crossovers, and divergences.
PPO readings are not subject to the price level of the security and the PPO values for different securities can be compared, regardless of the price of the security.
Relative Strength (RS)
Relative strength is a strategy used in momentum investing and focuses on investing in stocks or other securities that have performed well relative to the market as a whole or to a relevant benchmark.
Chart
In the chart, Microsoft stock (MSFT) is plotted against the VanEck Semiconductor ETF (SMH).
In the example on the left, from the negative values of the RS PPO it can be seen that MSFT, although trending upward, is losing out in negative terms to the SMH etf.
In the example on the right, during a correction phase with a downward price trend, Microsoft held up relatively well compared to the Van Eck Semiconductor etf.
Release Notes
Percentage Price Oscillator (PPO)The Percentage Price Oscillator (PPO) is a momentum oscillator that measures the difference between two moving averages as a percentage of the larger moving average. As with its cousin, MACD, the Percentage Price Oscillator is shown with a signal line, a histogram and a centerline. Signals are generated with signal line crossovers, centerline crossovers, and divergences.
PPO readings are not subject to the price level of the security and the PPO values for different securities can be compared, regardless of the price of the security.
Relative Strength (RS)
Relative strength is a strategy used in momentum investing and focuses on investing in stocks or other securities that have performed well relative to the market as a whole or to a relevant benchmark.
Chart
In the chart, Microsoft stock (MSFT) is plotted against the VanEck Semiconductor ETF (SMH).
In the example on the left, from the negative values of the RS PPO it can be seen that MSFT, although trending upward, is losing out in negative terms to the SMH etf.
In the example on the right, during a correction phase with a downward price trend, Microsoft held up relatively well compared to the Van Eck Semiconductor etf.
Updated (10/12/2024):
* added MA Type options
Open-source script
In true TradingView spirit, the creator of this script has made it open-source, so that traders can review and verify its functionality. Kudos to the author! While you can use it for free, remember that republishing the code is subject to our House Rules.
Disclaimer
The information and publications are not meant to be, and do not constitute, financial, investment, trading, or other types of advice or recommendations supplied or endorsed by TradingView. Read more in the Terms of Use.