OPEN-SOURCE SCRIPT
Updated FV 15min MS_230906_co
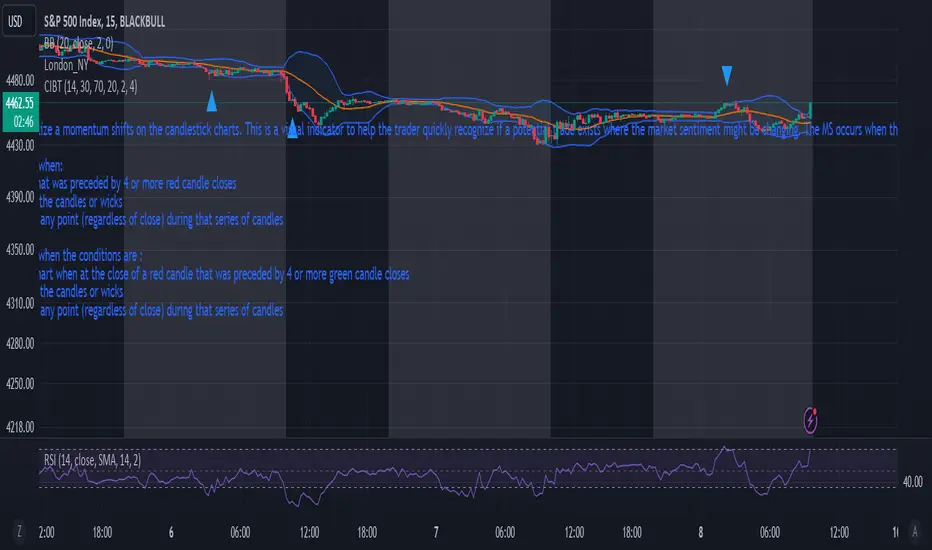
This script allows the user to visualize a momentum shifts on the candlestick charts. This is a visual indicator to help the trader quickly recognize if a potential trade exists where the market sentiment might be changing. The MS occurs when the below parameters are followed:
Creates blue triangle on the chart when:
1) at the close of a green candle that was preceded by 4 or more red candle closes
2) The RSI falls below 30 during of the candles or wicks
3) The bollinger band is pierced at any point (regardless of close) during that series of candles
Creates blue triangle on the chart when the conditions are :
1) creates a blue triangle on the chart when at the close of a red candle that was preceded by 4 or more green candle closes
2) The RSI goes above 70 during of the candles or wicks
3) The bollinger band is pierced at any point (regardless of close) during that series of candles
Release Notes
This script allows the user to visualize a momentum shifts on the candlestick charts. This is a visual indicator to help the trader quickly recognize if a potential trade exists where the market sentiment might be changing. The MS occurs when the below parameters are followed:Creates blue triangle on the chart when:
1) at the close of a green candle that was preceded by 4 or more red candle closes
2) The RSI falls below 30 during of the candles or wicks
3) The bollinger band is pierced at any point (regardless of close) during that series of candles
Creates blue triangle on the chart when the conditions are :
1) creates a blue triangle on the chart when at the close of a red candle that was preceded by 4 or more green candle closes
2) The RSI goes above 70 during of the candles or wicks
3) The bollinger band is pierced at any point (regardless of close) during that series of candles
Open-source script
In true TradingView spirit, the creator of this script has made it open-source, so that traders can review and verify its functionality. Kudos to the author! While you can use it for free, remember that republishing the code is subject to our House Rules.
Disclaimer
The information and publications are not meant to be, and do not constitute, financial, investment, trading, or other types of advice or recommendations supplied or endorsed by TradingView. Read more in the Terms of Use.