OPEN-SOURCE SCRIPT
Normalised ATR - Configurable Session Volatility Analysis
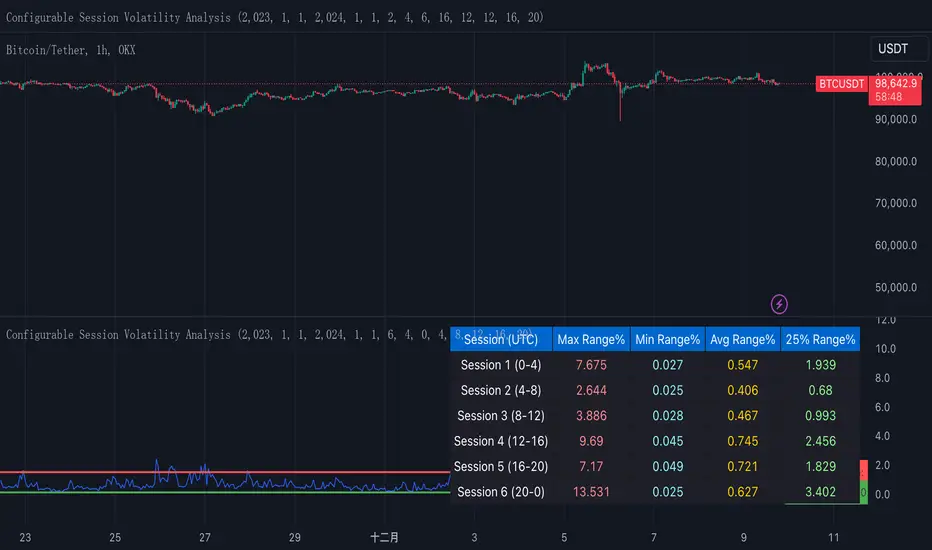
This indicator analyzes price volatility across different trading sessions throughout the day. Here are its key features:
1. **Configurable Time Periods**
- Users can set specific date ranges for analysis
- Supports up to 12 customizable trading sessions
- Adjustable session durations (1-8 hours each)
2. **Volatility Measurements**
- Offers two calculation methods:
* Normalized Range: (High-Low)/Midpoint Price × 100 (as percentage)
* Absolute Range: Simple High-Low difference
- Tracks key statistics for each session:
* Maximum range
* Minimum range
* Average range
* 25% quartile range
3. **Statistical Analysis**
- Calculates 5th and 95th percentiles across all sessions
- Provides visual reference lines for these percentiles
- Shows detailed statistics in a color-coded table
4. **Visual Display**
- Clear tabular display of session statistics
- Color-coded for easy reading
- Plot of daily ranges with percentile bounds
- Session times displayed in UTC
This tool is particularly useful for:
- Understanding market volatility patterns across different trading sessions
- Identifying optimal trading hours
- Planning trading strategies based on historical volatility patterns
- Comparing volatility across different market periods
Open-source script
In true TradingView spirit, the creator of this script has made it open-source, so that traders can review and verify its functionality. Kudos to the author! While you can use it for free, remember that republishing the code is subject to our House Rules.
Disclaimer
The information and publications are not meant to be, and do not constitute, financial, investment, trading, or other types of advice or recommendations supplied or endorsed by TradingView. Read more in the Terms of Use.