OPEN-SOURCE SCRIPT
(Rate of) Change %
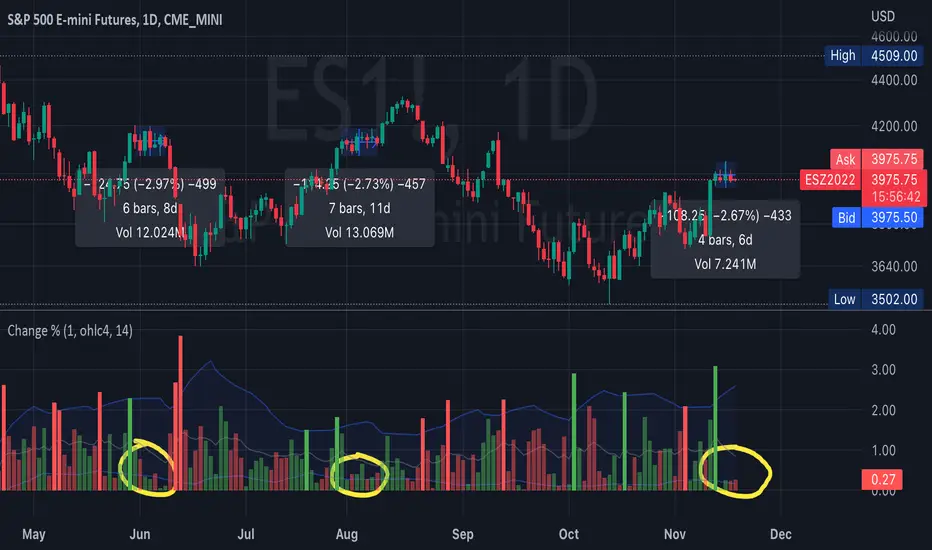
Displays the % change since an amount of given bars and plots the average high and low % changes for that period in a band. This helps you track outlier moves and periods of low or high volatility.

Set the "Change since" values to see the rate of change which can be used as a momentum indicator.

You can plot daily returns over the last 20 years for Nasdaq:
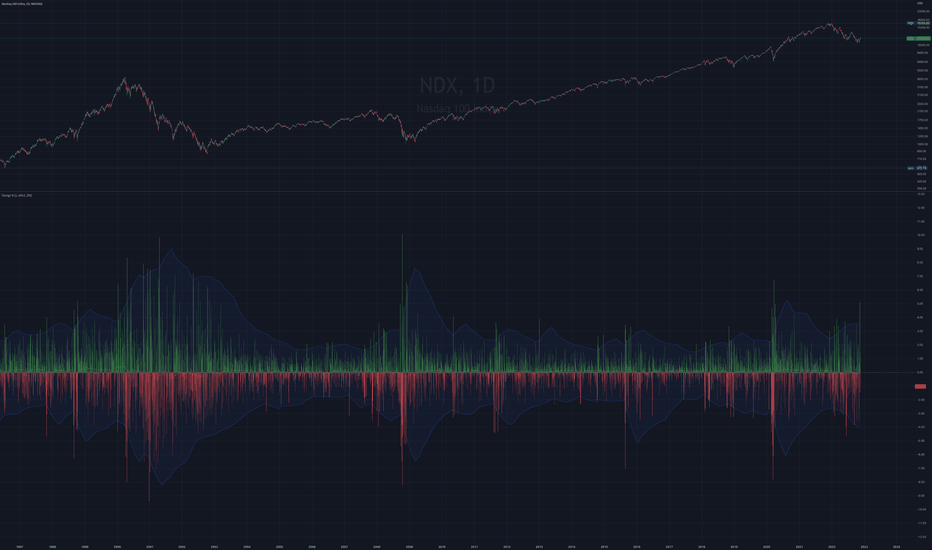
Set the "Change since" values to see the rate of change which can be used as a momentum indicator.
You can plot daily returns over the last 20 years for Nasdaq:
Open-source script
In true TradingView spirit, the creator of this script has made it open-source, so that traders can review and verify its functionality. Kudos to the author! While you can use it for free, remember that republishing the code is subject to our House Rules.
Disclaimer
The information and publications are not meant to be, and do not constitute, financial, investment, trading, or other types of advice or recommendations supplied or endorsed by TradingView. Read more in the Terms of Use.