OPEN-SOURCE SCRIPT
[blackcat] L2 Trend Guard Oscillator
OVERVIEW
📊 The L2 Trend Guard Oscillator is a comprehensive technical analysis framework designed specifically to identify market trend reversals using adaptive filtering algorithms that combine price action dynamics with statistical measures of volatility and momentum.
Key Purpose:
Generate reliable early warning signals before major trend changes occur
Provide clear directional bias indicators aligned with institutional investor behavior patterns
Offer risk-managed entry/exit opportunities suitable for various timeframes
TECHNICAL FOUNDATION EXPLAINED
🎓 Core Mechanism Breakdown:
[Custom Weighted Moving Average Function:]
→ Advanced smoothing technique emphasizing recent data points more heavily than older ones
↓ Reduces lag while maintaining signal integrity compared to traditional MA approaches
[Primary Calculation Layers:]
• Short-term Momentum Assessment:
🔶 Relative strength between closing prices vs lower bounds
• Long-term Directional Bias Analysis:
📈 Extended timeframe comparison generating structural context
• Defense Level Generation:
➜ Protective boundary calculation incorporating EMAs for stability enhancement
PARAMETER CONFIGURATION GUIDE
🔧 Adjustable Settings Explained In Detail:
[yellow]Timeframe Selection:**
↔ Controls lookback period sensitivity affecting responsiveness
↕ Adjusts reaction speed vs accuracy trade-off dynamically
[purple]Weight Factor Specification:**
⚡ Influences emphasis on newer versus historical observations
🎯 Defines key decision-making thresholds clearly
ALGORITHM EXECUTION FLOW
💻 Processing Sequence Overview:
[Data Collection & Preprocessing]:
→ Gather raw pricing inputs across required periods
↓ Normalize values preparing them for subsequent processing stages
[Momentum Derivation Phase]:
✔ Calculate relative strength positions against established ranges
❌ Filter outliers maintaining signal integrity consistently
[Signal Enhancement Pipeline:]
⟶ Apply dual-pass filtering reducing false signals effectively
➡ Generate actionable trading opportunities systematically
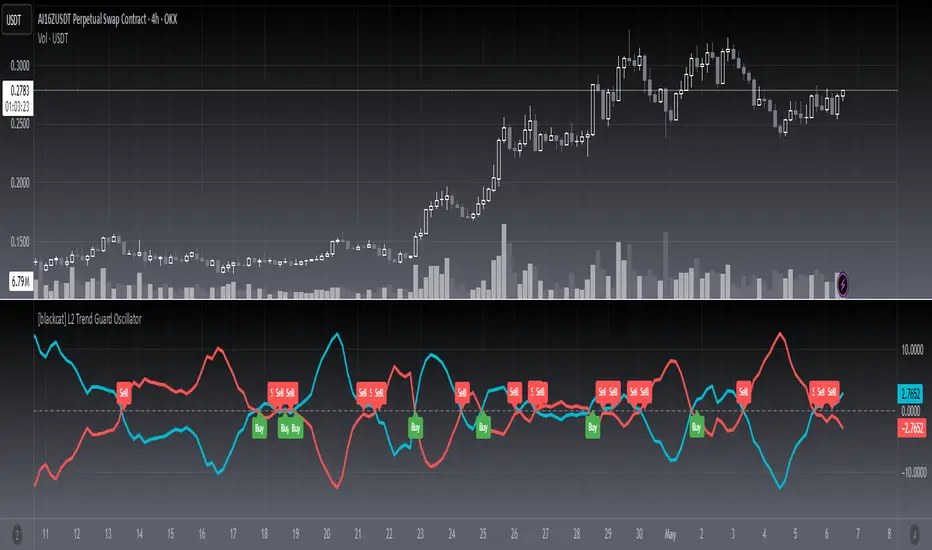
VISUALIZATION ARCHITECTURE
🎨 Display Elements Designated Purpose:
🔵 Primary Indicator Traces:
→ Aqua Trace: Buy/Sell Signal Progression
↑ Red Line: Opposing Force Boundary
🟥 Gray Dashed: Zero Reference Point
🏷️ Label System For Critical Events:
✅ BUY: Bullish Opportunity Markers
❌ SELL: Bearish Setup Validations
STRATEGIC IMPLEMENTATION FRAMEWORK
📋 Practical Deployment Steps:
Initial Integration Protocol:
• Select appropriate timeframe matching strategy objectives
• Configure input parameters aligning with target asset behavior traits
• Conduct thorough backtesting under simulated environments initially
Active Monitoring Procedures:
→ Regular observation of labeled event placements versus actual movements
↓ Track confirmation patterns leading up to signaled opportunities carefully
↑ Evaluate overall framework reliability across different regime types regularly
Execution Guidelines Formulation:
✔ Enter positions only after achieving minimum number of confirming inputs
❌ Avoid isolated occurrences lacking adequate supporting evidence always
➞ Look for convergent factors strengthening conviction before acting decisively
PERFORMANCE OPTIMIZATION TECHNIQUES
🚀 Continuous Improvement Strategies:
Parameter Calibration Approach:
✓ Start testing default suggested configurations thoroughly
↕ Gradually adjust individual components observing outcome changes methodically
✨ Document findings building personalized version profile incrementally
Context Adaptability Methods:
🔄 Add supplementary indicators enhancing overall reliability when needed
🔧 Remove unnecessary complexity layers avoiding confusion/distracted decisions
💫 Incorporate custom rules adapting specific security behaviors effectively
Efficiency Improvement Tactics:
⚙️ Streamline redundant computational routines wherever possible efficiently
♻️ Leverage shared data streams minimizing resource utilization significantly
⏳ Optimize refresh frequencies balancing update speed vs overhead properly
📊 The L2 Trend Guard Oscillator is a comprehensive technical analysis framework designed specifically to identify market trend reversals using adaptive filtering algorithms that combine price action dynamics with statistical measures of volatility and momentum.
Key Purpose:
Generate reliable early warning signals before major trend changes occur
Provide clear directional bias indicators aligned with institutional investor behavior patterns
Offer risk-managed entry/exit opportunities suitable for various timeframes
TECHNICAL FOUNDATION EXPLAINED
🎓 Core Mechanism Breakdown:
[Custom Weighted Moving Average Function:]
→ Advanced smoothing technique emphasizing recent data points more heavily than older ones
↓ Reduces lag while maintaining signal integrity compared to traditional MA approaches
[Primary Calculation Layers:]
• Short-term Momentum Assessment:
🔶 Relative strength between closing prices vs lower bounds
• Long-term Directional Bias Analysis:
📈 Extended timeframe comparison generating structural context
• Defense Level Generation:
➜ Protective boundary calculation incorporating EMAs for stability enhancement
PARAMETER CONFIGURATION GUIDE
🔧 Adjustable Settings Explained In Detail:
[yellow]Timeframe Selection:**
↔ Controls lookback period sensitivity affecting responsiveness
↕ Adjusts reaction speed vs accuracy trade-off dynamically
[purple]Weight Factor Specification:**
⚡ Influences emphasis on newer versus historical observations
🎯 Defines key decision-making thresholds clearly
ALGORITHM EXECUTION FLOW
💻 Processing Sequence Overview:
[Data Collection & Preprocessing]:
→ Gather raw pricing inputs across required periods
↓ Normalize values preparing them for subsequent processing stages
[Momentum Derivation Phase]:
✔ Calculate relative strength positions against established ranges
❌ Filter outliers maintaining signal integrity consistently
[Signal Enhancement Pipeline:]
⟶ Apply dual-pass filtering reducing false signals effectively
➡ Generate actionable trading opportunities systematically
VISUALIZATION ARCHITECTURE
🎨 Display Elements Designated Purpose:
🔵 Primary Indicator Traces:
→ Aqua Trace: Buy/Sell Signal Progression
↑ Red Line: Opposing Force Boundary
🟥 Gray Dashed: Zero Reference Point
🏷️ Label System For Critical Events:
✅ BUY: Bullish Opportunity Markers
❌ SELL: Bearish Setup Validations
STRATEGIC IMPLEMENTATION FRAMEWORK
📋 Practical Deployment Steps:
Initial Integration Protocol:
• Select appropriate timeframe matching strategy objectives
• Configure input parameters aligning with target asset behavior traits
• Conduct thorough backtesting under simulated environments initially
Active Monitoring Procedures:
→ Regular observation of labeled event placements versus actual movements
↓ Track confirmation patterns leading up to signaled opportunities carefully
↑ Evaluate overall framework reliability across different regime types regularly
Execution Guidelines Formulation:
✔ Enter positions only after achieving minimum number of confirming inputs
❌ Avoid isolated occurrences lacking adequate supporting evidence always
➞ Look for convergent factors strengthening conviction before acting decisively
PERFORMANCE OPTIMIZATION TECHNIQUES
🚀 Continuous Improvement Strategies:
Parameter Calibration Approach:
✓ Start testing default suggested configurations thoroughly
↕ Gradually adjust individual components observing outcome changes methodically
✨ Document findings building personalized version profile incrementally
Context Adaptability Methods:
🔄 Add supplementary indicators enhancing overall reliability when needed
🔧 Remove unnecessary complexity layers avoiding confusion/distracted decisions
💫 Incorporate custom rules adapting specific security behaviors effectively
Efficiency Improvement Tactics:
⚙️ Streamline redundant computational routines wherever possible efficiently
♻️ Leverage shared data streams minimizing resource utilization significantly
⏳ Optimize refresh frequencies balancing update speed vs overhead properly
Open-source script
In true TradingView spirit, the creator of this script has made it open-source, so that traders can review and verify its functionality. Kudos to the author! While you can use it for free, remember that republishing the code is subject to our House Rules.
Avoid losing contact!Don't miss out! The first and most important thing to do is to join my Discord chat now! Click here to start your adventure: discord.com/invite/ZTGpQJq 防止失联,请立即行动,加入本猫聊天群: discord.com/invite/ZTGpQJq
Disclaimer
The information and publications are not meant to be, and do not constitute, financial, investment, trading, or other types of advice or recommendations supplied or endorsed by TradingView. Read more in the Terms of Use.