OPEN-SOURCE SCRIPT
Updated SLB | RSI 2W
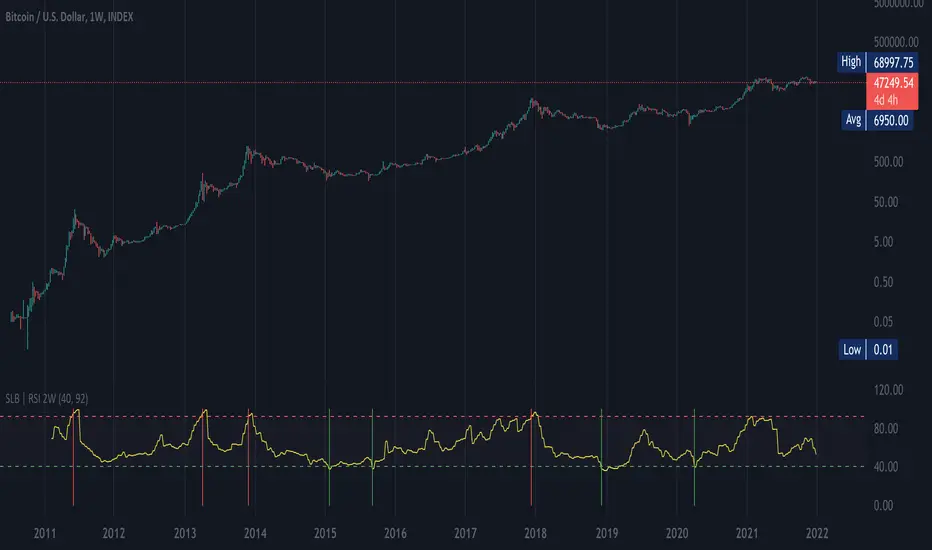
This script shows RSI ( Relative Strength Index ) over a 2 week period (RSI2W). The RSI2W is used by some traders to identify tops and valleys.
Taking historical BTC values as an example, the RSI 92+ (red lines) matches with the historical tops, and the RSI 40- (green lines) matches with the valleys, a good chance of bull markets' start.
Taking historical BTC values as an example, the RSI 92+ (red lines) matches with the historical tops, and the RSI 40- (green lines) matches with the valleys, a good chance of bull markets' start.
Release Notes
moving default max rsi value from 92 to 91Open-source script
In true TradingView spirit, the creator of this script has made it open-source, so that traders can review and verify its functionality. Kudos to the author! While you can use it for free, remember that republishing the code is subject to our House Rules.
Disclaimer
The information and publications are not meant to be, and do not constitute, financial, investment, trading, or other types of advice or recommendations supplied or endorsed by TradingView. Read more in the Terms of Use.
Open-source script
In true TradingView spirit, the creator of this script has made it open-source, so that traders can review and verify its functionality. Kudos to the author! While you can use it for free, remember that republishing the code is subject to our House Rules.
Disclaimer
The information and publications are not meant to be, and do not constitute, financial, investment, trading, or other types of advice or recommendations supplied or endorsed by TradingView. Read more in the Terms of Use.