OPEN-SOURCE SCRIPT
21-Day Trend Direction
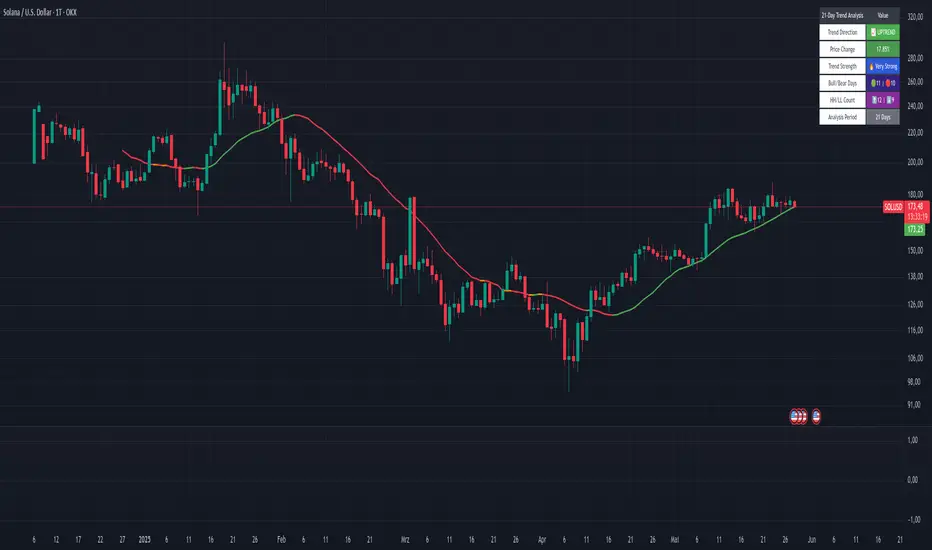
📈 21-Day Trend Direction Indicator
📊 How It Works:
🎯 Trend Detection Logic:
Analyzes last 21 daily candles
Calculates total price change from start to end
Compares against sideways threshold (default 2%)
Counts bullish vs bearish days
Tracks higher highs and lower lows
📈 Trend Classifications:
• 📈 UPTREND: Price change > +2% over 21 days
• 📉 DOWNTREND: Price change < -2% over 21 days
• ➡️ SIDEWAYS: Price change between -2% and +2%
💪 Trend Strength Levels:
• 🔥 Very Strong: >5% price change
• 💪 Strong: 3-5% price change
• 📊 Moderate: 1.5-3% price change
• 📉 Weak: <1.5% price change
🎨 Visual Features:
📋 Information Table Shows:
• Trend Direction with color coding
• Price Change % over 21 days
• Trend Strength classification
• Bull/Bear Days count
• Higher Highs/Lower Lows count
• Analysis Period (customizable)
📊 Chart Indicators:
• Trend Line (21-day moving average)
• Background Color for quick trend identification
• Trend Arrows (▲ ▼ ➡) on chart
• Customizable display options
⚙️ Customizable Settings:
🎯 Analysis Settings:
• Lookback Days: 5-50 days (default: 14)
• Sideways Threshold: 0.5-10% (default: 2%)
• Trend Strength: Low/Medium/High sensitivity
🎨 Display Options:
• Table Position: 9 different positions
• Table Size: Tiny to Large
• Show/Hide: Table, Trend Line, Background, Arrows
🚨 Alert Options:
• Trend Change to Uptrend
• Trend Change to Downtrend
• Trend Change to Sideways
This indicator gives you a clear, objective view of the 21-day trend with multiple confirmation signals! 🚀
Open-source script
In true TradingView spirit, the creator of this script has made it open-source, so that traders can review and verify its functionality. Kudos to the author! While you can use it for free, remember that republishing the code is subject to our House Rules.
Disclaimer
The information and publications are not meant to be, and do not constitute, financial, investment, trading, or other types of advice or recommendations supplied or endorsed by TradingView. Read more in the Terms of Use.