OPEN-SOURCE SCRIPT
Simple Monthly Seasonality
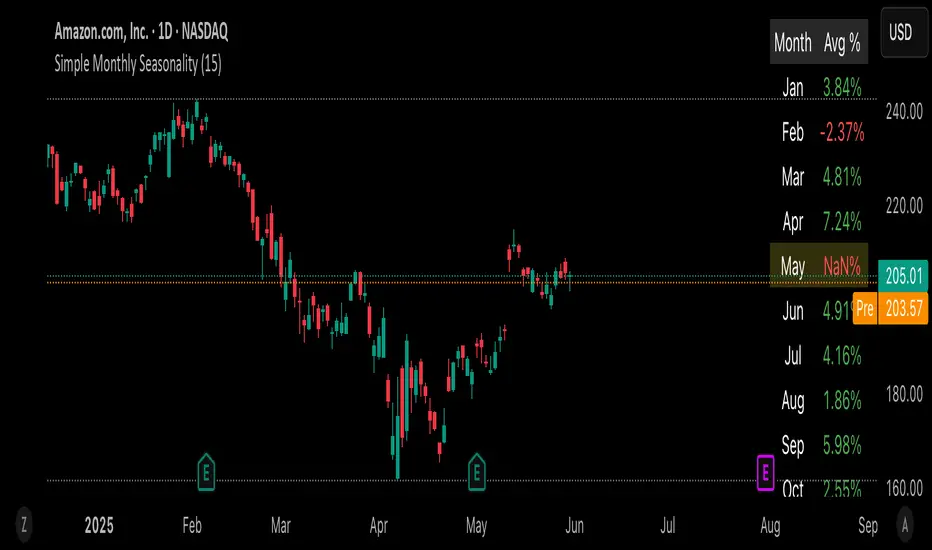
This script helps traders quickly visualize how an asset performs month by month over a customizable historical period.
🔍 What it does:
• Calculates average monthly returns over the past N years (default: 15).
• Highlights the current month for quick context.
• Displays results in a clean 2-column table (Month | Avg % Return).
💡 Features:
• Works on any timeframe – internally pulls monthly data.
• Color-coded performance (green for positive, red for negative).
• Dynamic highlights – the current month is softly emphasized.
• Fully customizable lookback period (1–50 years).
📈 Use cases:
• Spot seasonal market trends.
• Time entries/exits based on recurring historical strength/weakness.
• Build the foundation for more advanced seasonality or macro scripts.
Just load it on any chart and see which months historically outshine the rest.
⸻
Open-source script
In true TradingView spirit, the creator of this script has made it open-source, so that traders can review and verify its functionality. Kudos to the author! While you can use it for free, remember that republishing the code is subject to our House Rules.
Disclaimer
The information and publications are not meant to be, and do not constitute, financial, investment, trading, or other types of advice or recommendations supplied or endorsed by TradingView. Read more in the Terms of Use.