OPEN-SOURCE SCRIPT
Updated Liquidity Lines
Liquidity Lines Indicator
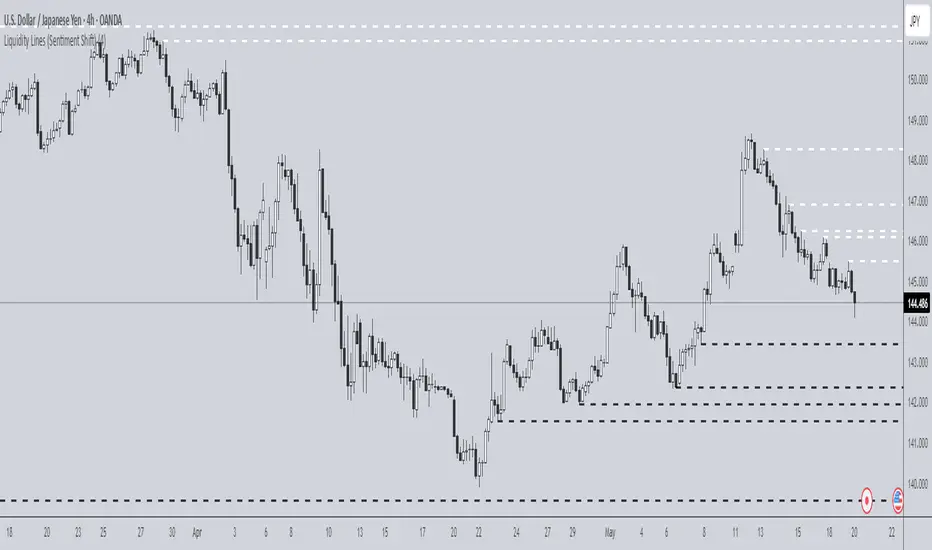
This advanced TradingView indicator identifies key liquidity zones on your price chart by detecting bullish and bearish engulfing candles, which often signify areas where liquidity accumulates. It helps traders visually spot potential support and resistance levels created by market participants’ stop-loss orders or pending orders.
Key Features:
-Aggregated Bars Option: Smooth out price data by grouping bars together, enabling clearer liquidity zone identification on higher timeframes or noisy charts.
-Upper Liquidity Lines: Displays dashed lines at recent highs where bearish engulfing patterns indicate potential resistance or supply zones.
-Lower Liquidity Lines: Displays dashed lines at recent lows where bullish engulfing patterns suggest potential support or demand zones.
-Customizable Colors: Choose your preferred colors for bullish (default black) and bearish (default white) liquidity lines for better visual distinction.
-Automatic Line Cleanup: Maintains chart clarity by automatically removing old liquidity lines after a configurable limit.
-Dynamic Alerts: Trigger alerts when price breaches upper or lower liquidity lines, signaling potential breakout or reversal opportunities.
Use Cases:
Release Notes
Line calculations updated for accuracyRelease Notes
Updated labels within scriptRelease Notes
Aggregation logic updatedRelease Notes
Line Width updated for visual clarityOpen-source script
In true TradingView spirit, the creator of this script has made it open-source, so that traders can review and verify its functionality. Kudos to the author! While you can use it for free, remember that republishing the code is subject to our House Rules.
Disclaimer
The information and publications are not meant to be, and do not constitute, financial, investment, trading, or other types of advice or recommendations supplied or endorsed by TradingView. Read more in the Terms of Use.
Open-source script
In true TradingView spirit, the creator of this script has made it open-source, so that traders can review and verify its functionality. Kudos to the author! While you can use it for free, remember that republishing the code is subject to our House Rules.
Disclaimer
The information and publications are not meant to be, and do not constitute, financial, investment, trading, or other types of advice or recommendations supplied or endorsed by TradingView. Read more in the Terms of Use.