OPEN-SOURCE SCRIPT
Linear Regression Log Channel with 3 Standard Deviations, Alerts
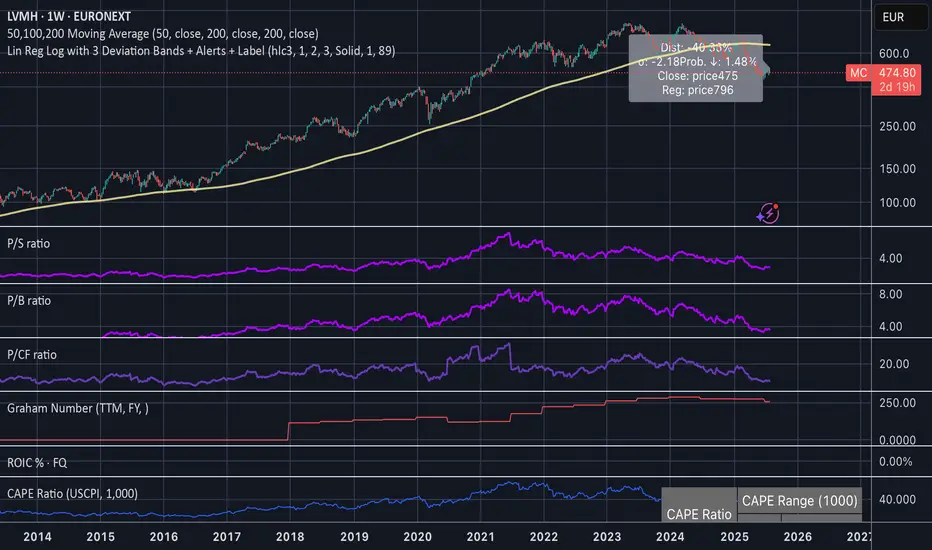
This indicator plots a logarithmic linear regression trendline starting from a user-defined date, along with ±1, ±2, and ±3 standard deviation bands. It is designed to help you visualize long-term price trends and statistically significant deviations.
Features:
• Log-scale linear regression line based on price since the selected start date
• Upper and lower bands at 1σ, 2σ, and 3σ, with the 3σ bands dashed for emphasis
• Optional filled channels between deviation bands
• Dynamic label showing:
• Distance from regression (in %)
• Distance in standard deviations (σ)
• Current price and regression value
• Estimated probability (assuming normal distribution) that the price continues moving further in its current direction
• Built-in alerts when price crosses the regression line or any of the deviation bands
This tool is useful for:
• Identifying mean-reversion setups or stretched trends
• Estimating likelihood of further directional movement
• Spotting statistically rare price conditions (e.g., >2σ or >3σ)
Open-source script
In true TradingView spirit, the creator of this script has made it open-source, so that traders can review and verify its functionality. Kudos to the author! While you can use it for free, remember that republishing the code is subject to our House Rules.
Disclaimer
The information and publications are not meant to be, and do not constitute, financial, investment, trading, or other types of advice or recommendations supplied or endorsed by TradingView. Read more in the Terms of Use.