OPEN-SOURCE SCRIPT
Updated Normalized Global Net Liquidity + HMA Smoothed RoC
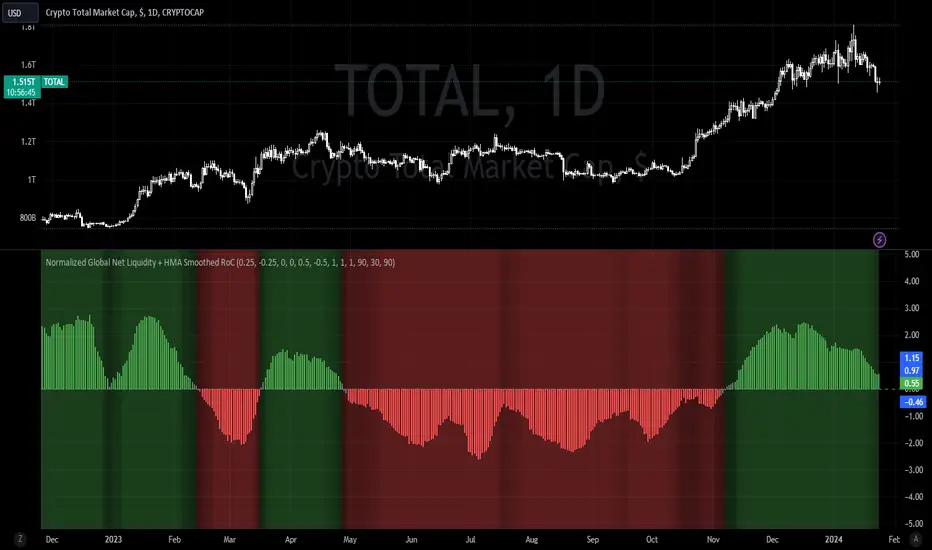
This script calculates "Global Net Liquidity" using various financial data sources, and integrates Rate of Change (RoC) visualization alongside an Equity Hull Moving Average (HMA) plot. It also features an additional "Global Liquidity" metric that is subsequently scaled and plotted.
First, several financial indicators are requested and combined to form the "Global Net Liquidity Indicator." A Rate of Change (RoC) is then calculated, and this RoC, alongside the Equity Hull Moving Average (HMA), is plotted. Next, a "Global Liquidity" measure is formed by combining various financial data.
In summary, this script involves achieving a comprehensive visualization of liquidity-related indicators and measures, providing an inclusive outlook into the nature of global liquidity trends.
The main plot is the 3 liquidity metrics averaged together and normalized then scaled between -1 and 1 for TPI scoring.
You can customize the weighting for each metric, as well as the lookback period for all 3 metrics.
-1 = Negative Trend
1 = Positive Trend
Yellow = Global Net Liquidity
Blue = RoC
Red = Equity HMA
This is insight into global liquidity, and not to be taken in anyway as trading signals. This is an analysis tool to be combined with further research.
Release Notes
Converted the AVG plot into a histogram. Added customizable thresholds for Positive and Negative detection levels. Added a gradient background fill to visualize overall global net liquidity trend.Release Notes
.Release Notes
Updated threshold settings.Open-source script
In true TradingView spirit, the creator of this script has made it open-source, so that traders can review and verify its functionality. Kudos to the author! While you can use it for free, remember that republishing the code is subject to our House Rules.
Disclaimer
The information and publications are not meant to be, and do not constitute, financial, investment, trading, or other types of advice or recommendations supplied or endorsed by TradingView. Read more in the Terms of Use.
Open-source script
In true TradingView spirit, the creator of this script has made it open-source, so that traders can review and verify its functionality. Kudos to the author! While you can use it for free, remember that republishing the code is subject to our House Rules.
Disclaimer
The information and publications are not meant to be, and do not constitute, financial, investment, trading, or other types of advice or recommendations supplied or endorsed by TradingView. Read more in the Terms of Use.