OPEN-SOURCE SCRIPT
Updated GCM Volatility-Adaptive Trend Channel
Script Description
Name: GCM Volatility-Adaptive Trend Channel (GCM VATC)
Overview
The GCM Volatility-Adaptive Trend Channel (VATC) is a comprehensive trading tool that merges the low-lag, smooth-trending capabilities of the Jurik Moving Average (JMA) with the classic volatility analysis of Bollinger Bands (BB).
By displaying both trend and volatility in a single, intuitive interface, this indicator aims to help traders see when a trend is stable versus when it's becoming volatile and might be poised for a change.
Core Components:
JMA Trend System: At its core are three dynamically colored JMA lines (Baseline, Fast, and Slow) that provide a clear view of trend direction. The lines change color based on their slope, offering immediate visual feedback on momentum. A colored ribbon between the Baseline and Fast JMA visualizes shorter-term momentum shifts.
Standard Bollinger Bands: Layered on top are standard Bollinger Bands. Calculated from the price, these bands serve as a classic measure of market volatility. They help identify periods where the market is expanding (high volatility) or contracting (low volatility).
How to Use It
By combining these two powerful concepts, this indicator provides a unified view of both trend and volatility. It can help traders to:
Identify the primary trend direction using the smooth JMA lines.
Gauge the strength and stability of that trend.
See when the market is becoming volatile (bands widening) or consolidating (bands contracting), which can often precede a significant price move or a change in trend.
A Note on Originality & House Rules Compliance
This indicator does not introduce a new mathematical formula. Instead, its strength lies in the thoughtful combination of two well-respected, publicly available concepts: the Jurik Moving Average and Bollinger Bands. The JMA implementation is a standard public version. The goal was to create a practical, all-in-one tool for trend and volatility analysis.
This script is published as fully open-source in compliance with TradingView's House Rules. It utilizes standard, publicly available algorithms and does not contain any protected or hidden code.
Settings
All lengths, sources, and colors for the JMA lines and Bollinger Bands are fully customizable in the settings menu, allowing you to tailor the indicator to your specific trading style and asset.
I hope with this indicator Traders even Beginner can can control their emotions which increase the probabilities of the winning rates and cutting the losing strength
Purposely I Didn't plant the High low or Buy Sell signals in the chart. Because everything is in the chart where volatility Signal with the Bollinger Band and Buy Sell Signal in the JMA Dynamic colors. and that's enough to decide when to take trade and when not to.
Thank You and Happy Trading
Release Notes
GCM Volatility-Adaptive Trend Channel (VATC)Summary Updates
The GCM Volatility-Adaptive Trend Channel (VATC) is a comprehensive trend-following and momentum system designed to provide clear, actionable insights directly on your chart. It masterfully combines the low-lag, smooth power of three Jurik Moving Averages (JMAs) for trend direction with the classic volatility context of Bollinger Bands (BB).
This indicator isn't just about lines; it's about signals. With a multi-layered system of visual cues for crossovers and volatility breaches, the VATC helps traders of all levels identify trend changes, momentum shifts, and potential market exhaustion points with ease.
Key Features
Triple JMA Trend System:
Baseline, Fast, and Slow JMAs: A multi-timeframe view of the trend, from immediate momentum to long-term direction.
Dynamic Line Coloring: Each JMA line automatically colors green for uptrends and red for downtrends based on its slope.
Trend Ribbon: The fill between the Baseline and Fast JMA provides a constant visual of the immediate trend (Green for bullish, Red for bearish).
Volatility-Adaptive Channel:
Standard Bollinger Bands: Provide a dynamic channel based on market volatility, helping to frame price action and identify overbought/oversold conditions.
Clear Crossover & Breach Signals:
✕ Baseline & Fast JMA Cross (Tiny X-Cross): Signals a potential short-term shift in momentum, ideal for scalping or fine-tuning entries.
◆ Baseline & Slow JMA Cross (Small Diamond): Indicates a more significant, mid-term change in the trend's character.
● Fast & Slow JMA Cross (Normal Circle): Highlights a major, long-term trend change, often used for confirmation.
▲▼ Volatility Breach (Tiny Triangles): A crucial caution signal appears whenever the JMA Baseline breaks outside the Bollinger Bands, alerting you to potential trend exhaustion or the start of a powerful new move.
How to Use
Identify the Main Trend: Use the color of the JMA lines and the main JMA ribbon to quickly gauge the current market direction. A green ribbon suggests looking for bullish opportunities, while a red ribbon suggests bearish setups.
Confirm with Crossovers: Use the hierarchy of crossover signals for entries and exits. A tiny X-Cross might signal an early entry, which can then be confirmed by a more significant diamond or circle crossover.
Manage Risk with Volatility: Pay close attention to the orange triangle signals. When the JMA Baseline breaches the Bollinger Bands, it suggests the price is stretched. This could be a signal to take profits, tighten stops, or wait for a pullback before entering a new position.
Customization
All settings for the JMAs (Source, Length, Phase, Power) and Bollinger Bands (Source, Length, Multiplier) are fully customizable in the indicator settings menu to fit your specific trading style and asset.
HAPPY TRADING
Release Notes
GCM Volatility-Adaptive Trend Channel with Volume & Crossover AnalysisOverview
This script is a comprehensive, multi-faceted indicator designed to identify trend direction, momentum, and potential entry/exit points with a high degree of visual clarity. It combines the responsiveness of Jurik Moving Averages (JMA) with the volatility context of Bollinger Bands®.
The latest updates introduce two powerful new features: Volume Spike Candle Highlighting and Multi-Stage Crossover Signals, which work together to provide deeper insight into market conviction and trend strength.
Key Features
Triple JMA System: A fast, responsive trend-following system using a Baseline, Fast, and Slow JMA.
Bollinger Bands®: A standard volatility channel to identify potential overbought/oversold conditions.
Volume Spike Candle Highlighting: Instantly see candles with significant buying or selling pressure.
Multi-Stage Crossover Signals: A unique labeling system (BC1, SC1, etc.) to classify the strength and maturity of a trend change.
How to Interpret the New Features
1. Volume Spike Candle Highlighting
This feature helps you instantly validate price action by highlighting candles that close with exceptionally high volume.
How it Works: It calculates a 20-period moving average of volume. If the current candle's volume is greater than this average, it gets highlighted.
Bright Green Candle (#2dff00): Signals a surge in Buying Pressure. This indicates strong conviction from buyers and can help confirm a bullish breakout or the start of a new uptrend.
Bright Red/Purple Candle (#e200ff): Signals a surge in Selling Pressure. This indicates strong conviction from sellers, potential panic, or a capitulation event that can confirm a bearish breakdown.
Use Case: A crossover signal is significantly more reliable when it is accompanied or quickly followed by a confirming high-volume candle.
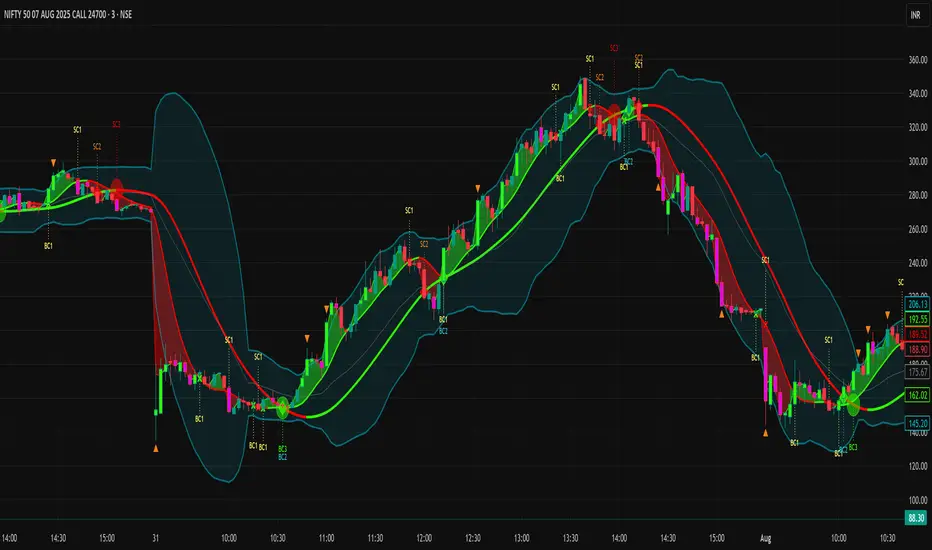
2. Multi-Stage Crossover Signals (BC/SC Labels)
This system provides a clear, hierarchical view of trend development by labeling three distinct types of JMA crossovers. A thin, dotted line connects the crossover point to a concise label, ensuring your chart remains clean.
BC = Buy Cross (Bullish)
SC = Sell Cross (Bearish)
The Three Stages:
Stage 1: BC1 / SC1 (Baseline / Fast JMA Cross)
Meaning: This is the earliest and most aggressive signal. It represents the first potential shift in short-term momentum.
Interpretation: Use this as an "early warning" that the market dynamics might be changing. It requires the most confirmation.
Stage 2: BC2 / SC2 (Baseline / Slow JMA Cross)
Meaning: This is a stronger confirmation signal. The very short-term trend (Baseline) has now crossed over the longer-term trend (Slow JMA).
Interpretation: This suggests that the new trend is beginning to solidify and gain strength.
Stage 3: BC3 / SC3 (Fast / Slow JMA Cross)
Meaning: This is the strongest confirmation signal, representing a major trend alignment where the medium-term trend (Fast JMA) aligns with the long-term trend (Slow JMA).
Interpretation: This often occurs after a trend is already well-established and indicates significant, sustained momentum.
Example Strategy
Initiation: A BC1 signal appears, putting you on alert for a potential bullish move.
Validation: A bright green high-volume candle appears on or shortly after the BC1 signal, validating the buying interest.
Confirmation: The trend continues, and a BC2 signal prints, confirming that the short-term strength is now influencing the longer-term trend.
Continuation: As the trend matures, a BC3 signal appears, indicating the trend is now firmly established.
By combining these signals, traders can build a more confident and nuanced picture of the market, moving from early warnings to strong confirmations.
This script is for educational purposes and should not be considered financial advice. Always use risk management and test any strategy thoroughly.
Release Notes
GCM Volatility-Adaptive Trend Channel (VATC)Description:
The GCM Volatility-Adaptive Trend Channel (VATC) is a comprehensive, all-in-one overlay designed to identify trend direction, momentum, and potential volatility-based exhaustion points. By combining the ultra-smooth Jurik Moving Average (JMA) with classic Bollinger Bands and volume analysis, this indicator provides a clear, multi-faceted view of the market.
It is designed to give traders an at-a-glance understanding of the trend's health through a sequence of crossover signals, a colored trend ribbon, and volatility warnings.
Key Features:
Triple JMA Core: Uses three distinct JMAs (Baseline, Fast, and Slow) to define short, medium, and long-term momentum. The JMA's low-lag, smooth nature provides cleaner signals than traditional MAs.
Trend-Confirming Crossovers: Generates three stages of Bullish (BC) and Sell (SC) crossover signals, helping you track a trend's development from initiation to confirmation.
Dynamic Trend Ribbon: The fill between the Baseline and Fast JMAs instantly visualizes the current short-term trend direction (Green for bullish, Red for bearish).
Volatility Channel: Integrated Bollinger Bands act as a dynamic price channel. Crossovers of the JMA Baseline above or below the bands signal potential over-extension or a "mean reversion" setup.
Volume Spike Detection: Highlights candles with unusually high volume, indicating strong conviction from buyers or sellers and helping to confirm the strength of a move.
Highly Customizable: All JMA, Bollinger Band, and visual settings can be fully configured to suit your trading style and asset.
⭐ What's New in This Version? ⭐
This update focuses on improving the clarity and customization of the crossover signals!
NEW: Custom Colors for Crossover Labels! The primary and secondary crossover labels now have unique, high-visibility colors to make them easier to distinguish at a glance:
BC1 / SC1: Bright Yellow - The initial warning signal.
BC2: Cyan - The first confirmation of a bullish trend.
SC2: Orange - The first confirmation of a bearish trend.
BC3: Green - The second confirmation of a bullish trend
SC3: Red - The second confirmation of a bearish trend.
NEW: Adjustable Label Line Length: You can now control the length of the dotted line connecting the crossover to its label directly in the settings. Make them longer or shorter to fit your chart perfectly!
IMPROVED: More Labels On-Screen: The default maximum number of visible labels has been increased from 5 to 10, allowing you to see more historical signals without cluttering the chart.
We hope you enjoy these new visual enhancements. Happy trading
Open-source script
In true TradingView spirit, the creator of this script has made it open-source, so that traders can review and verify its functionality. Kudos to the author! While you can use it for free, remember that republishing the code is subject to our House Rules.
Disclaimer
The information and publications are not meant to be, and do not constitute, financial, investment, trading, or other types of advice or recommendations supplied or endorsed by TradingView. Read more in the Terms of Use.