OPEN-SOURCE SCRIPT
SP500 Earnings Yield Spread: SP500 vs 3 Month & 10 Year Treasury
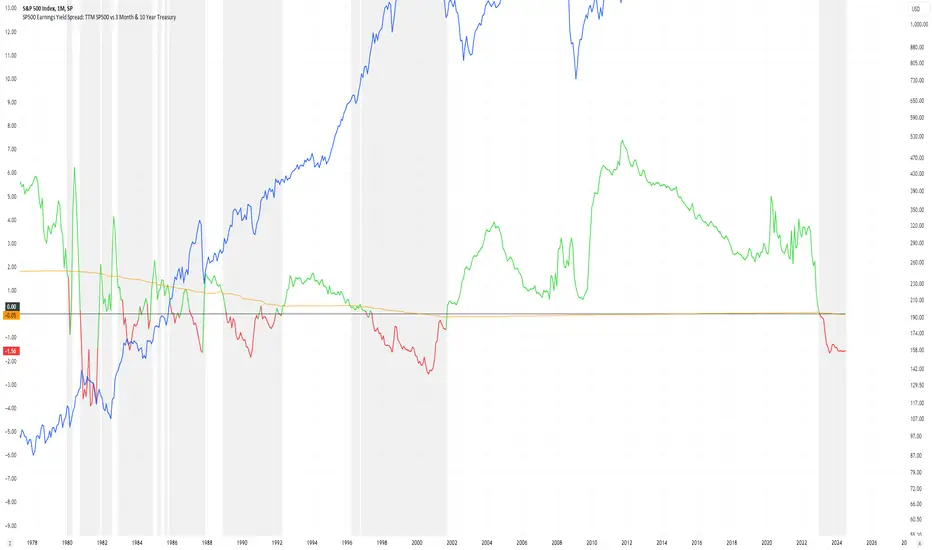
Add the SP500 ttm Earnings Yield Spreads vs the 3 Month and 10 Year Treasury Rates.
Short Spread = SP500 E/P ttm - 3 Month Treasury Rate
Long Spread = SP500 E/P ttm - 10 Year Treasury Rate
Symbol "SP500_EARNINGS_YIELD_MONTH" as the SP500 Earnings Yield
Symbol "US03MY" as the 3 Month Treasury Rate
Symbol "US10Y" as the 10 Year Treasury Rate
Based on research suggesting Earnings Yield and Interest Rates may have predictive power of future returns:
- Market-Timing Strategies That Worked? - Pu Shen [2002]
- Valuation Ratios and the Long-Run Stock Market Outlook - Campbell and Shiller [1998]
Inputs:
Short Term Spread - Line for Short Term Spread
Long Term Spread - Line for Long Term Spread
Zero Line - Horizontal line at 0
Color Lines Based on Spread - Color the spreads green/red if spread is positive/negative
Short 10th PCT - Line for Short Term Spread 10th percentile of historical values
Long 10th PCT - Line for Long Term Spread 10th percentile of historical values
Shade Below 10 PCT: Spread Must be Negative - Requirement the spread is negative to shade background
Shade Background Below Short 10th Percentile - Shade the background if the Short Term Spread is below its 10th percentile. (and spread is negative if input above chosen)
Shade Background Below Long 10th Percentile - Shade the background if the Long Term Spread is below its 10th percentile. (and spread is negative if input above chosen)
Open-source script
In true TradingView spirit, the creator of this script has made it open-source, so that traders can review and verify its functionality. Kudos to the author! While you can use it for free, remember that republishing the code is subject to our House Rules.
Disclaimer
The information and publications are not meant to be, and do not constitute, financial, investment, trading, or other types of advice or recommendations supplied or endorsed by TradingView. Read more in the Terms of Use.