OPEN-SOURCE SCRIPT
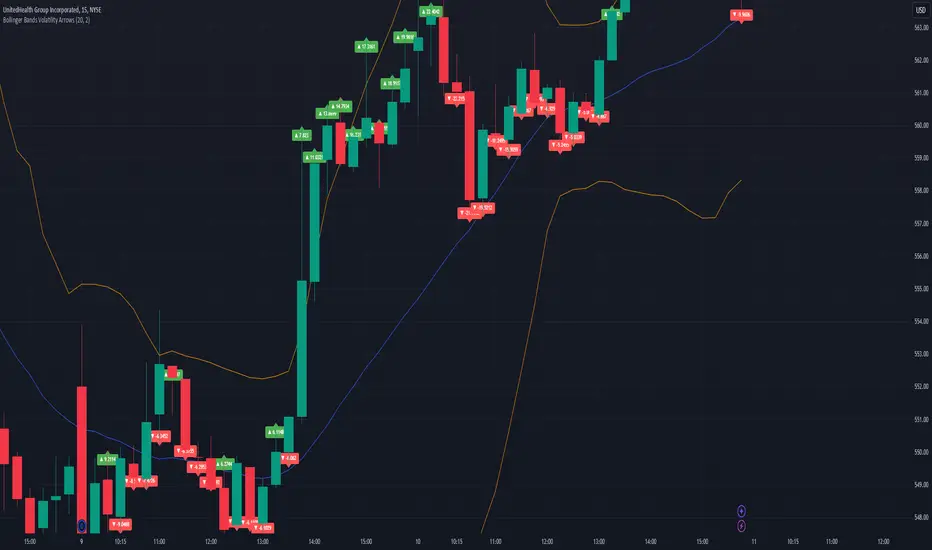
Bollinger Bands Volatility Arrows
Explanation of Changes:
Arrow Style:
Green Up Arrow (▲): Indicates increasing volatility with a positive value.
Red Down Arrow (▼): Indicates decreasing volatility with a negative value.
Labels with Arrows:
label.new is used to create arrows with the label.style_label_up or label.style_label_down styles.
The numerical value of the volatility is displayed beside the arrow using str.tostring.
Label Position:
For increasing volatility, the green arrow is placed near the high of the candle.
For decreasing volatility, the red arrow is placed near the low of the candle.
Text Format:
Includes the arrow symbol and the volatility value (formatted to 4 decimal places).
How It Works:
You’ll see green upward arrows for increasing volatility and red downward arrows for decreasing volatility.
Each arrow includes the exact value of the Bollinger Bands width at that moment.
Open-source script
In true TradingView spirit, the creator of this script has made it open-source, so that traders can review and verify its functionality. Kudos to the author! While you can use it for free, remember that republishing the code is subject to our House Rules.
Disclaimer
The information and publications are not meant to be, and do not constitute, financial, investment, trading, or other types of advice or recommendations supplied or endorsed by TradingView. Read more in the Terms of Use.