OPEN-SOURCE SCRIPT
Updated M2 Global Liquidity Index - X Days Lead
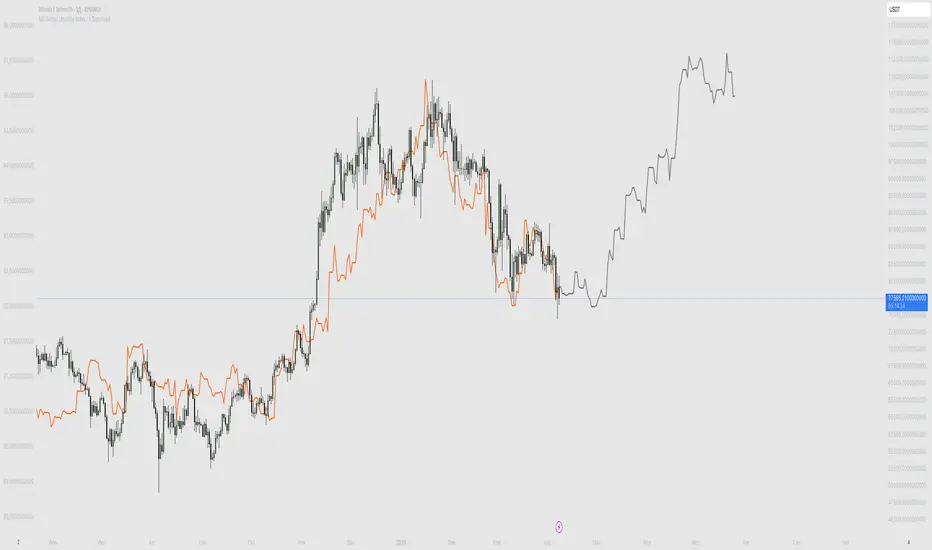
This custom indicator overlays the Bitcoin price chart with the Global Liquidity M2 chart, providing a unique perspective on how monetary supply might influence Bitcoin's price movements. The indicator distinguishes between past and future segments of the liquidity data using two distinct colors.
- Past Segment: The portion of the Global Liquidity M2 chart that has already passed is displayed in one color, allowing users to assess historical correlations with Bitcoin's price.
- Future Segment: The upcoming part of the liquidity chart is shown in a different color, offering insights into potential future impacts on Bitcoin's price trajectory.
by walkin
Release Notes
This custom indicator overlays the Bitcoin price chart with the Global Liquidity M2 chart, providing a unique perspective on how monetary supply might influence Bitcoin's price movements. The indicator distinguishes between past and future segments of the liquidity data using two distinct colors.- Past Segment: The portion of the Global Liquidity M2 chart that has already passed is displayed in one color, allowing users to assess historical correlations with Bitcoin's price.
- Future Segment: The upcoming part of the liquidity chart is shown in a different color, offering insights into potential future impacts on Bitcoin's price trajectory.
by walkin
Open-source script
In true TradingView spirit, the creator of this script has made it open-source, so that traders can review and verify its functionality. Kudos to the author! While you can use it for free, remember that republishing the code is subject to our House Rules.
Disclaimer
The information and publications are not meant to be, and do not constitute, financial, investment, trading, or other types of advice or recommendations supplied or endorsed by TradingView. Read more in the Terms of Use.