OPEN-SOURCE SCRIPT
Auto Draw Tool
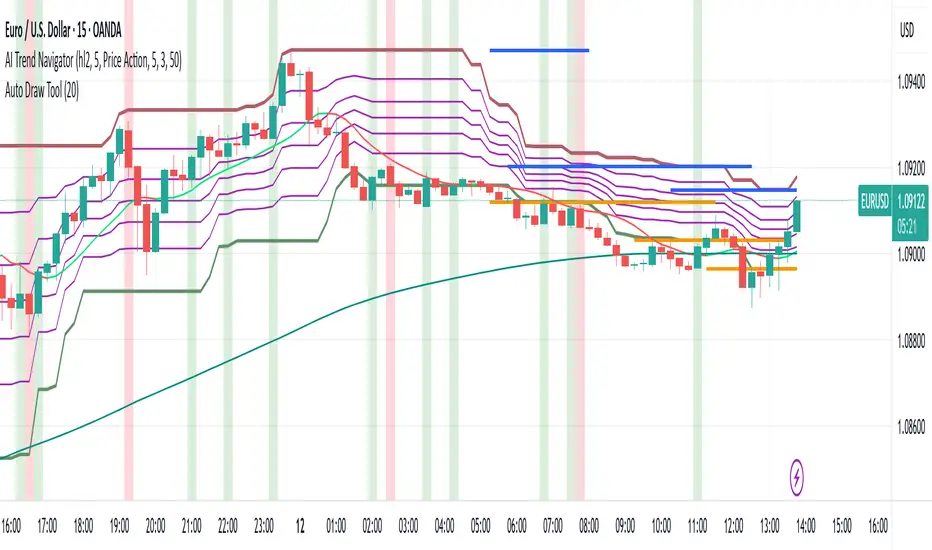
Auto Draw Tool for TradingView – Trend, Support/Resistance & Fibonacci Indicator ( HIMANSHU AGNIHOTRY)
The Auto Draw Tool is a powerful TradingView indicator that automatically detects trend lines, support & resistance levels, and Fibonacci retracement zones. It helps traders identify key price levels and market trends without manual effort.
🔹 Features
✔ Automatic Support & Resistance Detection – Finds the strongest price levels based on past highs and lows
✔ Trend Line Auto-Plotting – Detects market trends using swing highs and lows
✔ Fibonacci Retracement Levels – Highlights key retracement points for potential reversals
✔ Candlestick Pattern Detection – Identifies bullish and bearish engulfing patterns
✔ Background Alerts for Patterns – Highlights candlestick patterns with color-coded backgrounds
✔ Works on Any Timeframe – Suitable for scalping, swing trading, and long-term investing
🛠 How It Works?
Support & Resistance Levels: The script calculates the highest and lowest price levels within a given lookback period.
Trend Line Identification: It detects swing highs and swing lows to draw automatic trend lines.
Fibonacci Retracement: The script marks important Fibonacci levels (0%, 23.6%, 38.2%, 50%, 61.8%, 78.6%, 100%) for potential entry and exit points.
Engulfing Candlestick Patterns: It recognizes bullish engulfing and bearish engulfing patterns, which indicate strong buying or selling pressure.
Alerts & Background Highlighting: When an engulfing pattern is detected, the background color changes (green for bullish, red for bearish).
🔔 Alerts & Signals
🚀 Bullish Engulfing Detected: Green background & buy signal alert
🚀 Bearish Engulfing Detected: Red background & sell signal alert
🎯 Who Can Use It?
✅ Day Traders & Scalpers – Quickly identify key price action levels
✅ Swing Traders – Find strong support/resistance and Fibonacci retracement areas
✅ Trend Followers – Confirm trend direction with auto-drawn trend lines
✅ Price Action Traders – Get real-time candlestick pattern alerts
Open-source script
In true TradingView spirit, the creator of this script has made it open-source, so that traders can review and verify its functionality. Kudos to the author! While you can use it for free, remember that republishing the code is subject to our House Rules.
Disclaimer
The information and publications are not meant to be, and do not constitute, financial, investment, trading, or other types of advice or recommendations supplied or endorsed by TradingView. Read more in the Terms of Use.