OPEN-SOURCE SCRIPT
Updated Prior Day High/Low and Highest High/Lowest Low
Features:
Prior Day High and Low:
The script tracks and displays the previous trading day's high and low prices. These levels can serve as important areas of support or resistance, helping traders to make informed decisions about potential price reversals or breakouts.
Highest High and Lowest Low Over N Days:
This indicator also tracks and displays the highest high and lowest low over the last N days, where N is user-configurable. This allows traders to see broader trends in price action and identify key levels for potential trend changes.
User-Configurable Inputs:
Visual Display:
The indicator uses distinct colors and plotting styles:
Prior Day High and Low:
The script tracks and displays the previous trading day's high and low prices. These levels can serve as important areas of support or resistance, helping traders to make informed decisions about potential price reversals or breakouts.
Highest High and Lowest Low Over N Days:
This indicator also tracks and displays the highest high and lowest low over the last N days, where N is user-configurable. This allows traders to see broader trends in price action and identify key levels for potential trend changes.
User-Configurable Inputs:
- Show Prior Day High/Low: Toggle whether to display the prior day’s high and low levels.
- Days to Consider for Highest High/Lowest Low: Define the number of days over which the highest high and lowest low are calculated.
- Show Highest High/Lowest Low: Toggle whether to display the highest high and lowest low levels over the specified period.
- Low Source and High Source: Customize the data sources for the high and low values.
- Automatic Data Handling:
- The script automatically tracks the daily high and low prices, storing them in arrays, and calculates the highest and lowest prices over the user-specified number of days. When a new day begins, the prior day's data is saved, and the calculations are updated accordingly.
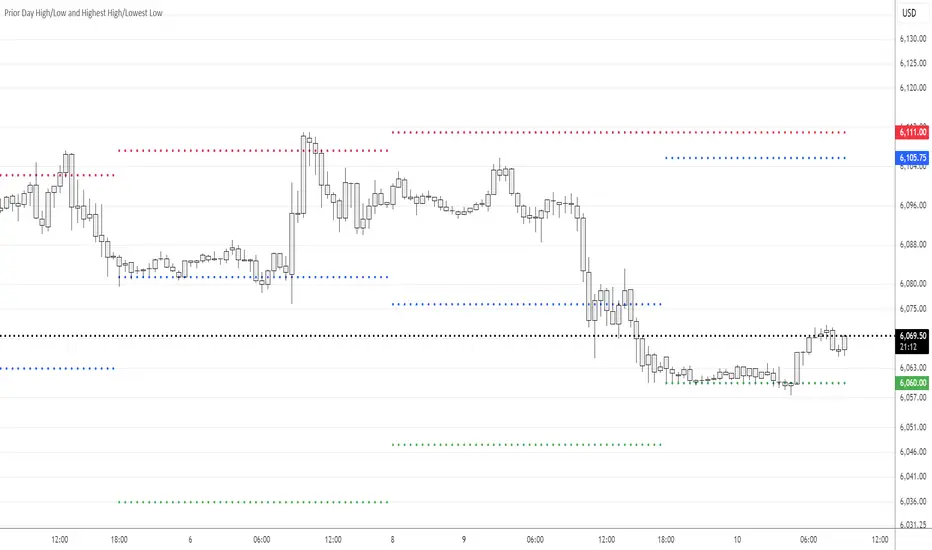
Visual Display:
The indicator uses distinct colors and plotting styles:
- Prior day’s high and low are plotted as blue circles.
- The highest high over N days is plotted as a red circle.
- The lowest low over N days is plotted as a green circle.
- This indicator helps traders stay informed about significant price levels, which are often used in trading strategies for breakouts, trend following, or reversals.
Release Notes
V6 updateOpen-source script
In true TradingView spirit, the creator of this script has made it open-source, so that traders can review and verify its functionality. Kudos to the author! While you can use it for free, remember that republishing the code is subject to our House Rules.
Disclaimer
The information and publications are not meant to be, and do not constitute, financial, investment, trading, or other types of advice or recommendations supplied or endorsed by TradingView. Read more in the Terms of Use.
Open-source script
In true TradingView spirit, the creator of this script has made it open-source, so that traders can review and verify its functionality. Kudos to the author! While you can use it for free, remember that republishing the code is subject to our House Rules.
Disclaimer
The information and publications are not meant to be, and do not constitute, financial, investment, trading, or other types of advice or recommendations supplied or endorsed by TradingView. Read more in the Terms of Use.