OPEN-SOURCE SCRIPT
Updated Bollinger Bands %B + RSI
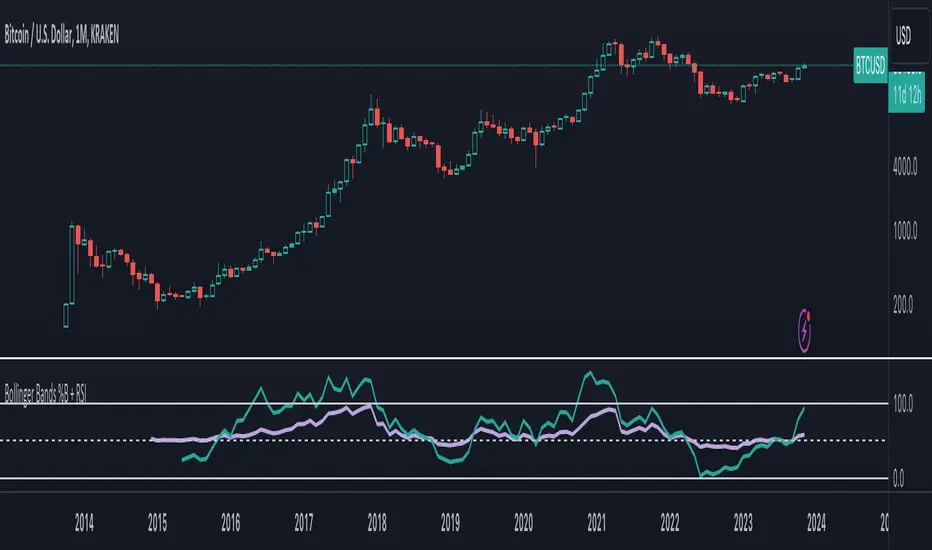
Bollinger Bands %b and RSI in one, and a experimental RSI cloud based in BB formula.
RSI scale goes from 0.00-1.00 instead of 0 -100.
RSI scale goes from 0.00-1.00 instead of 0 -100.
Release Notes
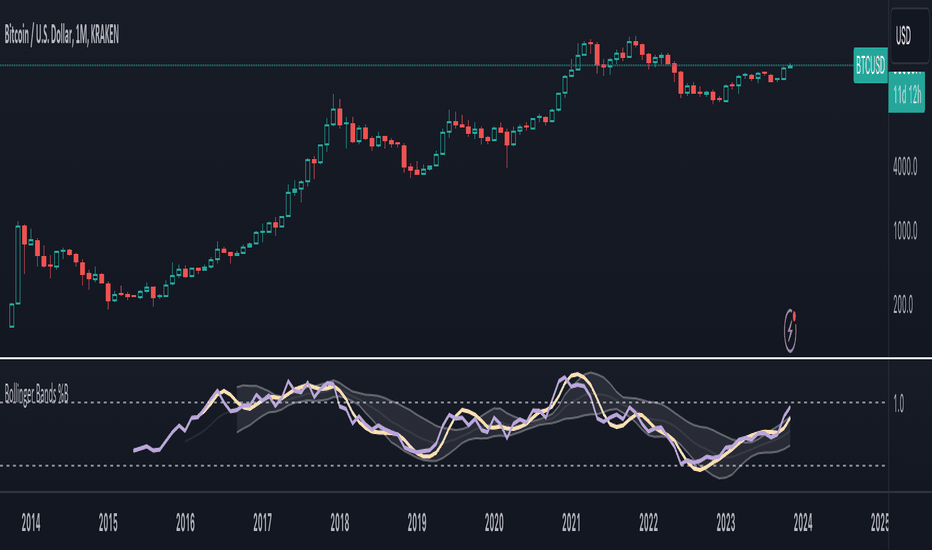
Changes settings to default values of original (RSi 14 periods and bb%b 20 periods).Added a subtile color change on bb%b when Stochastic do crossovers.
Changed values from 0-1 to 0-100, where bb%b over 100 is outside upper band and under 0 is outside lower band.
Release Notes
Fixed z-index on plots.Added stochastic color changes to rsi.
Release Notes
And now Hull MA crossover indications on bb%b (the teal line).The RSI show stochastic crossover (the purple line).
Strong color indicates upwards trend.
Pale color indicates downwards trend.
Release Notes
This is to abstract, so moving onwards with these two indicators: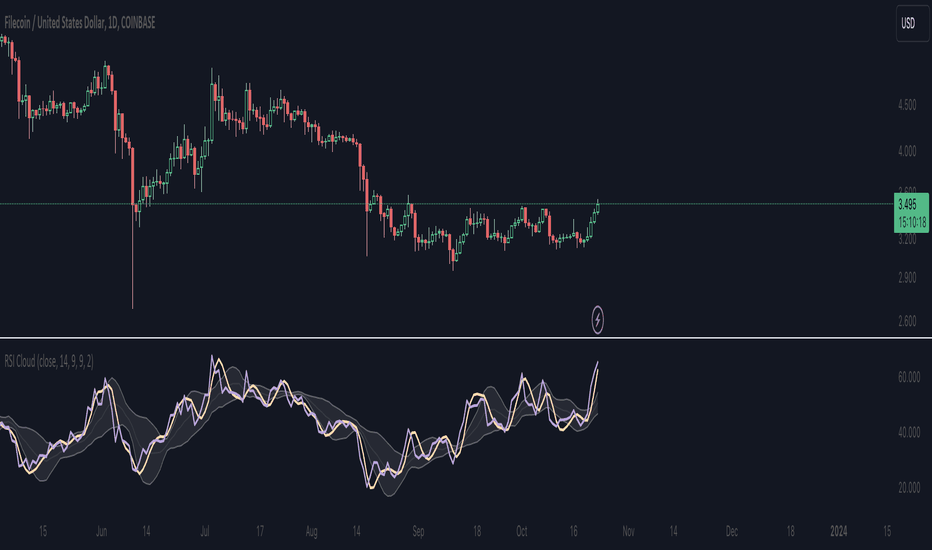
Will update if i find a good way to merge them again.
Release Notes
Added Hull.Release Notes
Updated script to Pinescript version 5.Open-source script
In true TradingView spirit, the creator of this script has made it open-source, so that traders can review and verify its functionality. Kudos to the author! While you can use it for free, remember that republishing the code is subject to our House Rules.
Disclaimer
The information and publications are not meant to be, and do not constitute, financial, investment, trading, or other types of advice or recommendations supplied or endorsed by TradingView. Read more in the Terms of Use.
Open-source script
In true TradingView spirit, the creator of this script has made it open-source, so that traders can review and verify its functionality. Kudos to the author! While you can use it for free, remember that republishing the code is subject to our House Rules.
Disclaimer
The information and publications are not meant to be, and do not constitute, financial, investment, trading, or other types of advice or recommendations supplied or endorsed by TradingView. Read more in the Terms of Use.