OPEN-SOURCE SCRIPT
Golden Ratio Multiplier (x1.6; x2; x3)
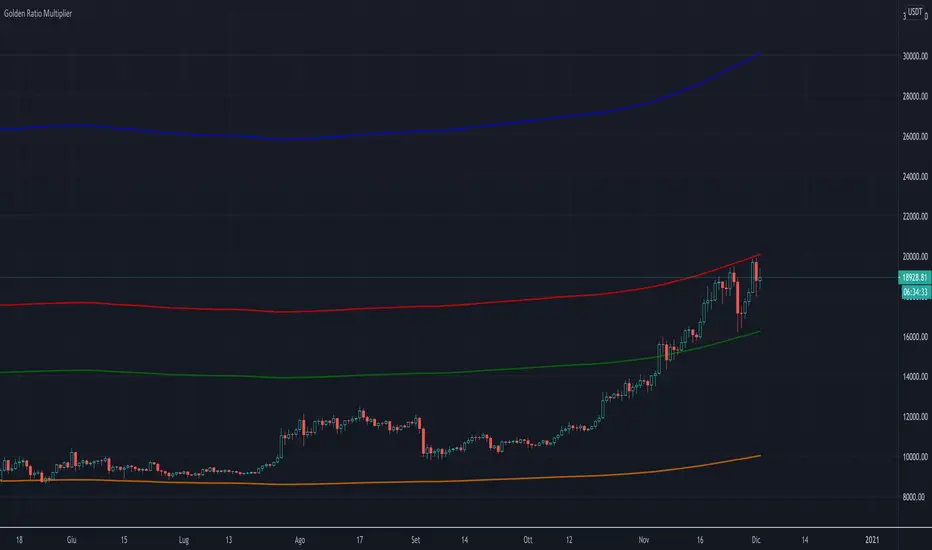
The script displays three multipliers (x1.618; x2; x3) of the Golden Ratio (starting with MA at 350 days) to identify the following levels of support:
Note: the orange line is the SMA at 350 days.
- the multiplier x1.618 is an accumulation high (green line)
- the multiplier x2 is a support that identify a low bull high (red line)
- the multiplier x3 is a support that identify an upper bull high (blu line)
Note: the orange line is the SMA at 350 days.
Open-source script
In true TradingView spirit, the creator of this script has made it open-source, so that traders can review and verify its functionality. Kudos to the author! While you can use it for free, remember that republishing the code is subject to our House Rules.
Disclaimer
The information and publications are not meant to be, and do not constitute, financial, investment, trading, or other types of advice or recommendations supplied or endorsed by TradingView. Read more in the Terms of Use.