OPEN-SOURCE SCRIPT
MACD Histogram Multi-Timeframe
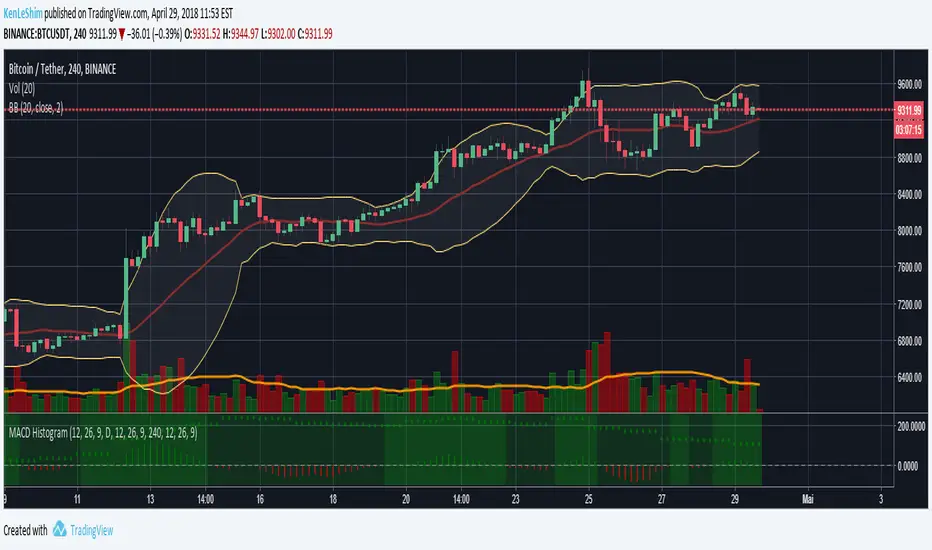
The MACD-Histogram represents the difference between the MACD (i.e., the between the two EMAs) and the signal line (i.e., the 9-day EMA of the MACD). The histogram is positive (i.e., above the zero line) when the MACD is above the signal line and negative when the MACD is below the signal line.
HOW IS IT USED ?
A bullish crossover occurs when the MACD histogram is negative and a bearish cross over occurs when the MACD histogram is negative.
I added the possibility to add on the chart a 2nd timeframe for confirmation.
If you found this script useful, a tip is always welcome... :)
HOW IS IT USED ?
A bullish crossover occurs when the MACD histogram is negative and a bearish cross over occurs when the MACD histogram is negative.
I added the possibility to add on the chart a 2nd timeframe for confirmation.
If you found this script useful, a tip is always welcome... :)
Open-source script
In true TradingView spirit, the creator of this script has made it open-source, so that traders can review and verify its functionality. Kudos to the author! While you can use it for free, remember that republishing the code is subject to our House Rules.
Disclaimer
The information and publications are not meant to be, and do not constitute, financial, investment, trading, or other types of advice or recommendations supplied or endorsed by TradingView. Read more in the Terms of Use.