OPEN-SOURCE SCRIPT
Updated 📊 TREND Indicator by Yogesh Mandloi 📊
This custom-built TradingView indicator provides a visual and logic-based trend analysis dashboard using 4-hour RSI and EMA/SMA conditions, combined with entry/exit signals, alerts, and a toggle-controlled condition table.
🔍 Core Logic
The strategy uses 4-hour timeframe data to identify potential bullish or bearish trends based on:
RSI (14):
Buy: RSI > 48
Sell: RSI < 52
EMA/SMA (Trend Filters):
Buy: EMA 21 > SMA 55 High → uptrend confirmation
Sell: EMA 21 < SMA 55 Low → downtrend confirmation
Buy Signal = RSI > 48 AND EMA21 > SMA55 High
Sell Signal = RSI < 52 AND EMA21 < SMA55 Low
It only signals on first bar of condition (no repetitive signals) and gives exit alerts when the condition ends.
📈 Features
✅ Signal Plotting
Green "BUY" arrows below bars when buy setup forms
Red "SELL" arrows above bars when sell setup forms
Gray "EXIT" markers when the trend condition invalidates
✅ Real-Time Alerts
Entry alerts for both BUY and SELL signals
Exit alerts to close positions
✅ Dynamic Visual Table
An on-screen signal table shows the live status of each condition with color-coded clarity:
✅ Green: Condition met
❌ Red: Condition not met
🟧 Orange: Warning (bearish potential forming)
✅ Toggle Switches for Sections
Users can control the visibility of each table section:
Buy Conditions ✔️
Sell Conditions 🔻
Signal Summary 📌
Indicator Values 📊
This makes it easier to focus on relevant sections or declutter the chart view.
✅ Customizable Table Position
You can change the table location:
top_left, top_right, bottom_left, bottom_right
✅ Background Highlights
Light Green background when buy conditions are active
Light Red background when sell conditions are active
Release Notes
📊 TREND Indicator by Yogesh Mandloi – DescriptionThis indicator combines RSI and EMA/SMA crossovers on the 4H timeframe to generate actionable Buy and Sell signals. It offers visual signals on the chart, exit alerts, and a customizable signal table.
✅ Core Logic
Buy Condition:
4H RSI > 48
4H EMA(21) > 4H SMA(55) of high
Sell Condition:
4H RSI < 52
4H EMA(21) < 4H SMA(55) of low
Entry signals are triggered only when a new condition starts.
Exit signals appear when the condition ends (trend weakens or reverses).
📌 On-Chart Features
Buy Arrow: Lime green arrow below bar when buy setup begins.
Sell Arrow: Red arrow above bar when sell setup begins.
Exit Markers: Gray X symbols when a condition ends.
🛎️ Alerts
Buy and Sell setup alerts.
Close (exit) alerts for both directions.
📋 Signal Table
The floating table includes:
✅ Buy Conditions status (RSI + MA confirmation)
🔻 Sell Conditions status (RSI + MA confirmation)
🔄 Signal Summary (Bullish/Bearish confirmation)
📈 Indicator Values (4H RSI, EMA21, SMA55 High & Low)
🔘 Toggle options to show/hide individual table sections.
🎨 Background Color Highlight
Light green when Buy condition is fully active.
Light red when Sell condition is fully active.
(Subtle for visual trend zone confirmation.)
🧩 Customizable Inputs
Table position: top-left, top-right, bottom-left, bottom-right.
Toggle sections: Buy/Sell logic, Signal Summary, Indicator values.
Release Notes
This indicator combines RSI and EMA/SMA crossovers on the 4H timeframe to generate actionable Buy and Sell signals. It offers visual signals on the chart, exit alerts, and a customizable signal table.✅ Core Logic
Buy Condition:
4H RSI > 48
4H EMA(21) > 4H SMA(55) of high
Sell Condition:
4H RSI < 52
4H EMA(21) < 4H SMA(55) of low
Entry signals are triggered only when a new condition starts.
Exit signals appear when the condition ends (trend weakens or reverses).
📌 On-Chart Features
Buy Arrow: Lime green arrow below bar when buy setup begins.
Sell Arrow: Red arrow above bar when sell setup begins.
Exit Markers: Gray X symbols when a condition ends.
🛎️ Alerts
Buy and Sell setup alerts.
Close (exit) alerts for both directions.
📋 Signal Table
The floating table includes:
✅ Buy Conditions status (RSI + MA confirmation)
🔻 Sell Conditions status (RSI + MA confirmation)
🔄 Signal Summary (Bullish/Bearish confirmation)
📈 Indicator Values (4H RSI, EMA21, SMA55 High & Low)
🔘 Toggle options to show/hide individual table sections.
🎨 Background Color Highlight
Light green when Buy condition is fully active.
Light red when Sell condition is fully active.
(Subtle for visual trend zone confirmation.)
🧩 Customizable Inputs
Table position: top-left, top-right, bottom-left, bottom-right.
Toggle sections: Buy/Sell logic, Signal Summary, Indicator values.
Release Notes
The TREND Indicator is a multi-factor trading tool designed to identify buy and sell opportunities on the 4-hour (4H) timeframe, combining momentum and trend logic through RSI and moving average analysis, with a clean visual dashboard.🔍 Core Logic & Conditions
✅ Buy Signal
A buy condition is triggered when:
RSI (14) > 48 (momentum shift upwards)
EMA 21 > SMA 55 High (short-term trend above long-term resistance)
🔻 Sell Signal
A sell condition is triggered when:
RSI (14) < 52 (momentum weakening)
EMA 21 < SMA 55 Low (short-term trend below long-term support)
The indicator waits for a new signal (i.e., condition becomes true now but was false in the previous candle) before showing BUY/SELL arrows.
📈 Trend Strength Measurement
A calculated trend strength score combines:
RSI deviation from neutral (50)
EMA vs. SMA gap as a percentage of price
This score classifies market conditions into:
Strong Bull
Moderate Bull
Weak Bull
Neutral
Weak Bear
Moderate Bear
Strong Bear
These categories are color-coded for visual clarity.
📋 Signal Table Dashboard
A compact, real-time table (optional via toggle) displays:
Metric Meaning
RSI ⬆⬇ Momentum direction (⬆ = Bullish)
MA ⬆⬇ Trend direction via EMA/SMA
Trend Strength Bull/Bear classification with color
RSI / MA Values Exact values of RSI, EMA21, SMA55
(Optional) RSI Trend Emoji sparkline (↗↘→) showing 3-bar trend
🔔 Alerts
Built-in alerts notify on:
✅ New Buy Signal
🔻 New Sell Signal
Messages include RSI and MA condition context.
Release Notes
🔍 Indicator PurposeThis indicator is a trend filter and signal generator that combines multiple confirmations (SuperTrend, EMA/SMA cross, RSI, MACD) on a higher timeframe to provide BUY/SELL zones, trend strength assessment, and visual + tabular summaries. It is designed to filter false signals and enhance trend-following accuracy.
📦 Core Components
1. SuperTrend Module (Higher Timeframe Based)
Uses an imported custom library from Electrified/SupportResitanceAndTrend to calculate the SuperTrend.
SuperTrend settings are configurable:
ATR Period, Multiplier, Deviation, and smoothing Mode (SMA/EMA/WMA/VWMA/VAWMA).
Operates on a selectable higher timeframe (default: 4H).
2. Buy/Sell Signal Generation
Buy/Sell signals occur when:
SuperTrend changes direction (trend flip).
Combined with confirmation logic:
RSI > 40 for buys, RSI < 60 for sells (on 4H).
EMA(21) > SMA(55 high) for buy; EMA(21) < SMA(55 low) for sell.
MACD Line > 0 (buy); MACD Line < 0 (sell).
3. Signal Arrows
Buy zone: Green "BUY ZONE" label under bar.
Sell zone: Red "SELL ZONE" label above bar.
Triggered only when a new condition occurs (edge detection).
📊 Signal Table
Optionally displayed with toggle:
Summarizes RSI, MA, MACD directional bias.
Includes Trend Strength label:
🔷 Strong Bull: All bullish (trend + RSI + MA + MACD).
🟢 Weak Bull: Partial confirmation.
🔴 Strong Bear / 🟠 Weak Bear for downtrends.
Signal Summary row shows:
✅ BUY, 🔻 SELL, ⏸️ WAIT based on current filter.
🌈 Background Highlighting
Light green background when in Buy Zone.
Light red background when in Sell Zone.
Provides visual zone context for decision-making.
🔔 Alerts
Alerts for:
Basic SuperTrend flips.
Buy/Sell Zone activation.
Alert conditions are clearly defined with unique messages.
⚙️ Customization
Inputs allow customization for:
Indicator visibility (table, summary, signals).
Table position.
SuperTrend settings.
Easily extendable for additional filters or timeframes.
✅ Advantages
Multi-factor trend confirmation on higher timeframe.
Clear labeling with arrows and strength classification.
Compact signal table with toggle support.
Easy-to-read background visual aids.
Release Notes
📊 TREND Indicator by Yogesh_MandloiThe TREND Indicator is a higher timeframe-based market sentiment tool that identifies bullish and bearish zones using a combination of RSI, EMA/SMA, and MACD confirmation logic. Designed to help traders stay aligned with broader market momentum, this script offers visual cues and compact signal summaries on the chart.
🔍 Core Features:
Multi-timeframe analysis: Uses 4-hour RSI, EMA, SMA, and MACD to determine market direction.
Buy/Sell Signal Arrows: Visual triangle markers for precise entries based on combined indicator confirmations.
Trend Strength Classification: Categorizes signals as Strong Bull, Weak Bull, Strong Bear, or Weak Bear, with emoji and color-coded feedback.
Compact Signal Table: Displays live RSI, MA, MACD conditions, and trend strength in a small, readable on-chart table.
Smart Alerts: Alerts trigger on new bullish or bearish zone signals, helping automate attention to key conditions.
✅ Buy Condition:
RSI > 50 (Bullish Momentum)
EMA21 > SMA55 High (Price Above Trend)
MACD Line > 0 (Positive Momentum)
❌ Sell Condition:
RSI < 50 (Bearish Momentum)
EMA21 < SMA55 Low (Price Below Trend)
MACD Line < 0 (Negative Momentum)
📉 Strength Logic:
Strong: All three indicators confirm the same direction.
Weak: Only two indicators confirm, but EMA condition must be true.
Neutral: No clear directional consensus or missing EMA alignment.
This indicator is optimized for trend-following strategies, momentum filtering, and higher timeframe confirmation in scalping, swing, or positional setups.
Release Notes
📊 TREND Indicator by Yogesh_MandloiThe TREND Indicator is a multi-confirmation trend analyzer designed for precise directional trading on TradingView. It uses higher timeframe confluence from RSI, EMA, SMA, MACD, and WaveTrend to identify strong and weak bullish/bearish zones. The tool helps traders make informed decisions by clearly displaying trend strength and individual component status via a compact, emoji-based table.
🔍 Core Features:
Higher Timeframe Confirmation (4H by default):
RSI > 45 indicates bullish bias.
EMA 21 > SMA 55 High or EMA 21 < SMA 55 Low detects directional momentum.
MACD > 0 or < 0 confirms trend direction.
WaveTrend Crosses:
Extra confirmation from WaveTrend (wt1/wt2 crossover) filtered with EMA bias to generate BUY and SELL labels.
Visual Arrows:
🔼 Green triangles for bullish entries.
🔽 Red triangles for bearish entries.
Trend Strength Labels:
🟢 Strong Bull: All three conditions agree in bullish direction.
🔴 Strong Bear: All three conditions agree in bearish direction.
🟢/🔴 Weak: Partial confirmation.
⏸️ Neutral: No valid trend bias.
Smart Signal Table (optional):
Displays real-time status of RSI, MA, MACD, and trend strength using colored ▲/▼ arrows.
Compact format with emojis for intuitive interpretation.
Alert Conditions:
Alerts for both entry zone activation (strong conditions) and WaveTrend crossover entries.
🧠 How to Use:
Look for BUY labels when all conditions align with bullish bias and EMA confirms upward trend.
Look for SELL labels when conditions align with bearish bias and EMA confirms downward trend.
Use table values and strength indicator to filter signals and avoid false entries.
Release Notes
This indicator is a powerful multi-confirmation trend detection tool designed to identify strong and weak bullish/bearish zones using higher timeframe data. It combines EMA/SMA trend logic, RSI momentum, MACD confirmation, and WaveTrend crossovers to generate precise trade signals.🔍 Key Features:
Higher Timeframe Confirmation: Uses 4H RSI, MACD, EMA, and SMA for reliable signal confirmation on lower timeframes.
Signal Strength Classification:
🟢 Strong Bull: EMA above SMA high + RSI > 55 + MACD > 0
🔴 Strong Bear: EMA below SMA low + RSI < 45 + MACD < 0
🟢/🔴 Weak: Partial confirmations
⏸️ Neutral: No significant trend detected
Visual Cues:
📈 Arrows (▲/▼) for trend condition signals
Color-coded signal table for instant market condition snapshot
BUY/SELL labels based on WaveTrend crossovers with trend alignment
WaveTrend Momentum Filtering: Filters out noise using TCI/WT1 crossover logic for enhanced entry timing
Alerts: Custom alerts for both trend zone activation and WaveTrend signal triggers
📋 Ideal Usage:
Trend-following strategy with higher timeframe filtering
Works best in trending markets on lower timeframes with higher timeframe confirmation
Combine with price action or support/resistance for discretionary trading
Release Notes
The TREND Indicator by Yogesh Mandloi is a powerful, high-timeframe trend analysis and signal tool designed for TradingView. It helps traders identify bullish and bearish market zones, evaluate trend strength, and detect entry signals using multi-indicator confirmations.
🔍 Key Features
Higher Timeframe Trend Zones:
Identifies BUY/SELL/NEUTRAL zones based on the relationship between EMA(21) and SMA(55) on a selected higher timeframe (default 240 min).
Color-coded zone: 🟢 Buy, 🔴 Sell, ⚪ Neutral.
Strength Analyzer Bars:
Strength visualized as horizontal bars like: ▮▮▯▯
Bullish strength (only shown in buy zone) based on:
RSI > 45
MACD > 0
ADX ≥ 25
+DI > -DI
Bearish strength (only shown in sell zone) based on:
RSI < 55
MACD < 0
ADX ≥ 25
-DI > +DI
WaveTrend Cross Entries:
Buy Signal: WaveTrend bullish cross under level 1 in buy zone
Sell Signal: WaveTrend bearish cross above -1 in sell zone
Signals are marked visually and trigger alerts.
Zone Shift Alerts:
EMA21 crossing SMA55 High/Low triggers zone activation alerts:
🟢 Buy Zone Activated
🔴 Sell Zone Activated
Compact Emoji Table Display (Optional):
Shows current Zone status with emoji + color
Displays Bull/Bear Strength using colored bars and dynamic background
Updates every 5 bars
🛠️ Customizable Inputs:
Table Toggle: Show/hide emoji table
Table Position: Choose location of the strength table
HTF Selection: Set the timeframe for trend evaluation (default 4H)
📈 Visual Signals:
LONG / SHORT labels based on WaveTrend cross
BUY ZONE / SELL ZONE labels based on EMA/SMA cross
This indicator combines price action, momentum, and trend confirmation logic, making it suitable for professional-grade discretionary trading, trend following, and momentum strategies.
Release Notes
The TREND Indicator by Yogesh Mandloi is a powerful, high-timeframe trend analysis and signal tool designed for TradingView. It helps traders identify bullish and bearish market zones, evaluate trend strength, and detect entry signals using multi-indicator confirmations.🔍 Key Features
Higher Timeframe Trend Zones:
Identifies BUY/SELL/NEUTRAL zones based on the relationship between EMA(21) and SMA(55) on a selected higher timeframe (default 240 min).
Color-coded zone: 🟢 Buy, 🔴 Sell, ⚪ Neutral.
Strength Analyzer Bars:
Strength visualized as horizontal bars like: ▮▮▯▯
Bullish strength (only shown in buy zone) based on:
RSI > 45
MACD > 0
ADX ≥ 25
+DI > -DI
Bearish strength (only shown in sell zone) based on:
RSI < 55
MACD < 0
ADX ≥ 25
-DI > +DI
WaveTrend Cross Entries:
Buy Signal: WaveTrend bullish cross under level 1 in buy zone
Sell Signal: WaveTrend bearish cross above -1 in sell zone
Signals are marked visually and trigger alerts.
Zone Shift Alerts:
EMA21 crossing SMA55 High/Low triggers zone activation alerts:
🟢 Buy Zone Activated
🔴 Sell Zone Activated
Compact Emoji Table Display (Optional):
Shows current Zone status with emoji + color
Displays Bull/Bear Strength using colored bars and dynamic background
Updates every 5 bars
🛠️ Customizable Inputs:
Table Toggle: Show/hide emoji table
Table Position: Choose location of the strength table
HTF Selection: Set the timeframe for trend evaluation (default 4H)
📈 Visual Signals:
LONG / SHORT labels based on WaveTrend cross
BUY ZONE / SELL ZONE labels based on EMA/SMA cross
This indicator combines price action, momentum, and trend confirmation logic, making it suitable for professional-grade discretionary trading, trend following, and momentum strategies.
Release Notes
🔍 OverviewThe Trend Strength Indicator is a multi-factor trend detection tool that quantifies bullish and bearish momentum using higher timeframe signals. It is designed to visually and quantitatively assess the strength of ongoing trends with precision and simplicity.
📐 Core Logic
This indicator evaluates four key components on the 240-minute (4-hour) timeframe:
RSI (Relative Strength Index)
Bullish: RSI > 60
Bearish: RSI < 40
MACD (Moving Average Convergence Divergence)
Bullish: MACD > 0
Bearish: MACD < 0
DMI (Directional Movement Index)
Bullish: +DI > −DI
Bearish: −DI > +DI
SMA 55 (Simple Moving Average)
Bullish: Current Price > 55-SMA
Bearish: Current Price < 55-SMA
Each condition contributes 1 point to either the Bull Strength or Bear Strength, resulting in a score ranging from 0 to 4.
📊 Visual Output
A clean emoji table is displayed on the chart (optional), showing:
🟢 Bull Strength
🔴 Bear Strength
The strength is displayed as a bar-style meter using block characters:
▯▯▯▯ = 0/4 (no strength)
▮▯▯▯ = 1/4
▮▮▯▯ = 2/4
▮▮▮▯ = 3/4
▮▮▮▮ = 4/4 (maximum strength)
🛎️ Signal Alerts
This indicator highlights potential trade signals when a new trend reaches full strength (4/4) for the first time:
Buy Signal (📈): When Bull Strength becomes 4/4 and was less than 4 on the previous candle
Sell Signal (📉): When Bear Strength becomes 4/4 and was less than 4 on the previous candle
✅ These signals are confirmed on the first candle where the transition to 4/4 occurs, helping traders spot strong emerging trends.
Optional alert conditions and entry plot markers (BUY/SELL) are provided for automation or notifications.
⚙️ Customization Options
Toggle the emoji-based table display
Position the table in any chart corner
Plot buy/sell signal shapes
Configure alerts based on signal triggers
📌 Use Cases
Confirm strength behind breakouts or breakdowns
Filter trend-based strategies (e.g., only enter trades on full-strength trends)
Use as a higher timeframe filter in multi-timeframe setups
Release Notes
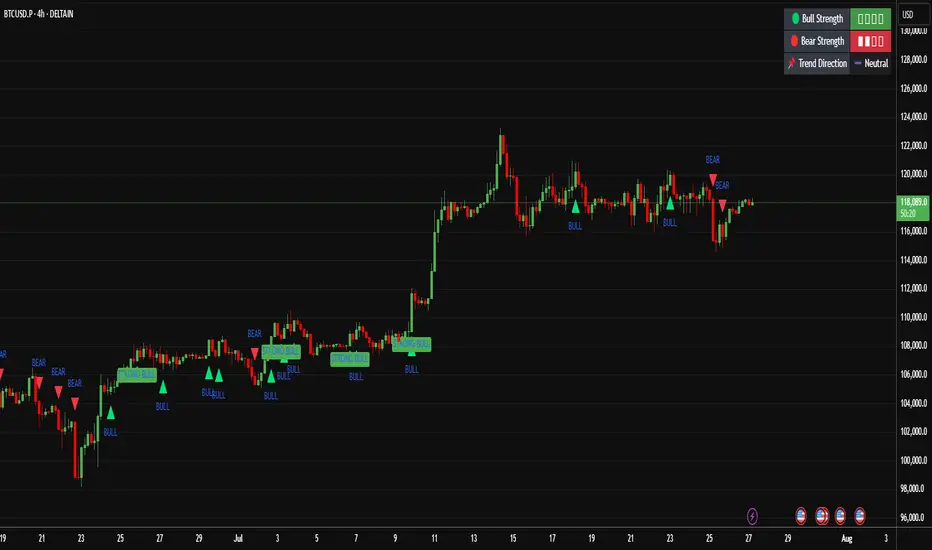
This indicator combines trend direction and trend strength logic using higher timeframe (HTF) signals and visualizes them in a compact emoji table on the chart. It's designed for professional-grade analysis with intuitive cues for bullish/bearish strength and trend direction changes.🧠 Core Logic & Features
✅ Higher Timeframe (240-minute / 4H) Analysis
RSI: Measures momentum strength. Bullish if RSI > 60, Bearish if RSI < 40.
MACD: Assesses momentum and trend direction. Compares MACD line vs Signal line.
Directional Index (DI+/DI−): Gauges directional strength. Plus DI > Minus DI = Bullish bias.
EMA/SMA Cross:
EMA 21 vs SMA 55 High/Low is used for determining the trend direction.
If EMA is above SMA (High) + MACD above zero → Bullish Trend.
If EMA is below SMA (Low) + MACD below zero → Bearish Trend.
📈 Strength Calculation (0 to 4 Scale)
Each of the 4 bullish and bearish strength conditions contributes 1 point:
✅ RSI
✅ MACD crossover
✅ DI+ vs DI−
✅ Price above/below EMA
Strength is displayed using bar-style emojis:
▯▯▯▯ (0/4) to ▮▮▮▮ (4/4)
📌 Trend Direction Detection
Bullish Trend: EMA 21 > SMA 55 High and MACD > 0
Bearish Trend: EMA 21 < SMA 55 Low and MACD < 0
If neither, considered Neutral.
Trend direction is shown with intuitive emojis:
📗 Bullish
📕 Bearish
➖ Neutral
🧾 On-Chart Table (Optional)
Displays:
🟢 Bull Strength: Visual scale from 0 to 4
🔴 Bear Strength: Visual scale from 0 to 4
📌 Trend Direction: Bullish / Bearish / Neutral
Location of the table is user-configurable (Top Right, Top Left, etc.).
🔔 Alerts & Visual Signals
Bull Signal (BUY): When Bull Strength transitions to 4/4
Bear Signal (SELL): When Bear Strength transitions to 4/4
Trend Change Alert: When trend direction flips to Bullish or Bearish
These are paired with plotshape() markers on the chart for clarity:
BUY triangle (below bar, lime)
SELL triangle (above bar, red)
Trend↑ / Trend↓ labels
🧪 Use Cases
Swing traders looking for HTF confirmation before entering positions
Trend-following systems that need strength + direction validation
Visual traders who benefit from intuitive emoji displays and table summaries
Release Notes
This is a powerful multi-timeframe technical analysis tool designed to detect market strength and trend direction with clear, visual, and intuitive emoji-based summaries.✅ Key Features:
Multi-Timeframe Analysis: Uses 4H (240m) higher timeframe inputs for better trend confirmation on your current chart timeframe.
Strength Detection:
Measures bullish and bearish market strength based on 4 key signals:
✅ RSI
✅ MACD
✅ DMI (+DI / -DI)
✅ Price vs SMA55
Visualized using bar-style meters: ▮▯▯▯ to ▮▮▮▮
Trend Direction Confirmation:
Combines EMA/SMA crossover with MACD trend alignment
Outputs clear trend status as:
📗 Bullish
📕 Bearish
➖ Neutral
Visual Table Display:
Emoji-based table shows real-time:
🟢 Bull Strength
🔴 Bear Strength
📌 Trend Direction
Customizable corner display
Entry Signal Alerts:
Generates alert + triangle shape when Bull or Bear strength turns to 4
Ideal for entering during strong directional momentum
Trend Shift Alerts:
Alerts when a new Strong Bullish or Strong Bearish trend begins
Uses EMA/SMA + MACD cross confirmation logic
Minimalist Visuals:
Non-intrusive plots below/above bars
Label-based trend confirmations
Smart Alert Conditions:
Set once and forget – alerts only fire on transitions, not repeatedly
📈 Use Case:
This indicator is ideal for:
Traders looking for clear trend bias
Multi-timeframe confirmation users
Entry signal filters for scalping, swing, or position trades
Reducing false signals using higher timeframe strength filters
🧠 How to Use:
Enable “Show Emoji Table” to monitor live trend + strength visually.
Watch for:
Bullish Strength = 4 ➜ 📈 Buy signal
Bearish Strength = 4 ➜ 📉 Sell signal
Confirm with trend direction in the table (Bullish/Bearish)
Use alerts and plots to trigger trades or support your own strategy logic
🛠️ Customization:
Choose which corner the summary table appears in.
Can be used standalone or added as a filter layer in a broader trading system.
🎯 Author: Yogesh Mandloi
🔗 For improvements, collabs or strategy version: Contact via TradingView or comment below.
Open-source script
In true TradingView spirit, the creator of this script has made it open-source, so that traders can review and verify its functionality. Kudos to the author! While you can use it for free, remember that republishing the code is subject to our House Rules.
Disclaimer
The information and publications are not meant to be, and do not constitute, financial, investment, trading, or other types of advice or recommendations supplied or endorsed by TradingView. Read more in the Terms of Use.