OPEN-SOURCE SCRIPT
WMA Trend and Growth Rate Indicator
The "WMA Trend and Growth Rate Indicator" is a powerful tool for analyzing market trends and momentum. By understanding its components and how to configure it, traders of all levels can leverage this indicator to enhance their trading strategies. Experiment with the settings and integrate it into your analysis to gain valuable insights into market movements.
Indicator Components
Key Concepts
Configuring the Inputs
Interpreting the Plots
The indicator checks if "Start" is greater than "End". Based on this check, it assigns colors to the accumulation and distribution levels. This color scheme helps traders visually distinguish between areas of potential buying and selling zones.
Indicator Components
- WMA Length: The length of the WMA. This controls how many periods are included in the calculation.
- Start: The starting value for accumulation levels.
- End: The ending value for accumulation levels.
Key Concepts
- Weighted Moving Average (WMA): A type of moving average that gives more weight to recent price data, making it more responsive to recent price changes.
- Growth Rate: Measures how much the WMA has increased or decreased over a specified period, expressed as a percentage.
- Accumulation and Distribution Levels: Zones where buying (accumulation) or selling (distribution) pressure is expected.
Configuring the Inputs
- WMA Length: Adjust this value to change the sensitivity of the WMA. A smaller value makes the WMA more sensitive to recent price changes, while a larger value smooths out the data more.
- Start and End: Adjust these values to define the range for accumulation and distribution levels. The indicator will automatically adjust the colors based on whether the Start value is higher or lower than the End value.
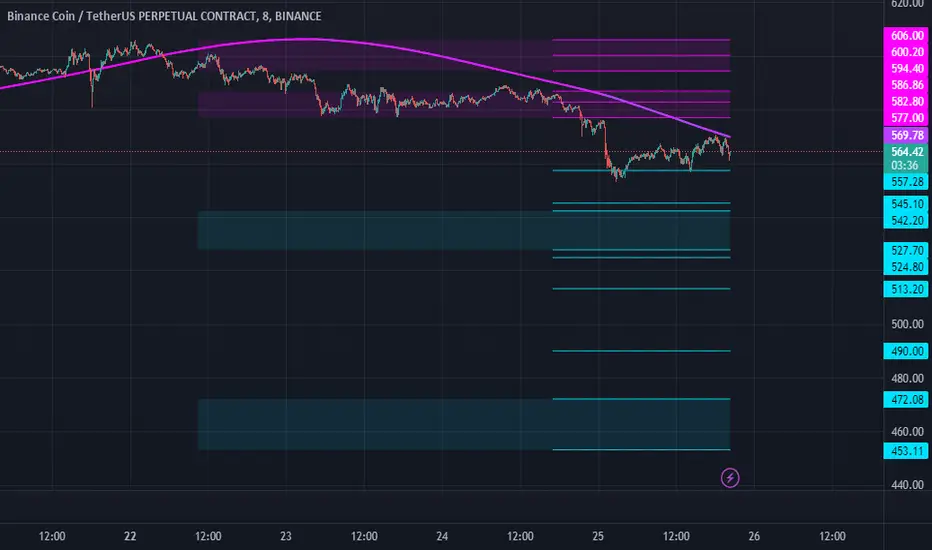
Interpreting the Plots
- WMAT Line: The main trend line that shows the direction and strength of the trend.
- Growth Index: Shows the growth rate of the WMAT.
- Accumulation Levels: Indicated by lines and fill colors, showing potential zones to increase positions.
- Distribution Levels: Indicated by lines and fill colors, showing potential zones to decrease positions.
The indicator checks if "Start" is greater than "End". Based on this check, it assigns colors to the accumulation and distribution levels. This color scheme helps traders visually distinguish between areas of potential buying and selling zones.
Open-source script
In true TradingView spirit, the creator of this script has made it open-source, so that traders can review and verify its functionality. Kudos to the author! While you can use it for free, remember that republishing the code is subject to our House Rules.
Disclaimer
The information and publications are not meant to be, and do not constitute, financial, investment, trading, or other types of advice or recommendations supplied or endorsed by TradingView. Read more in the Terms of Use.