OPEN-SOURCE SCRIPT
Updated Volume Heatmap Pro
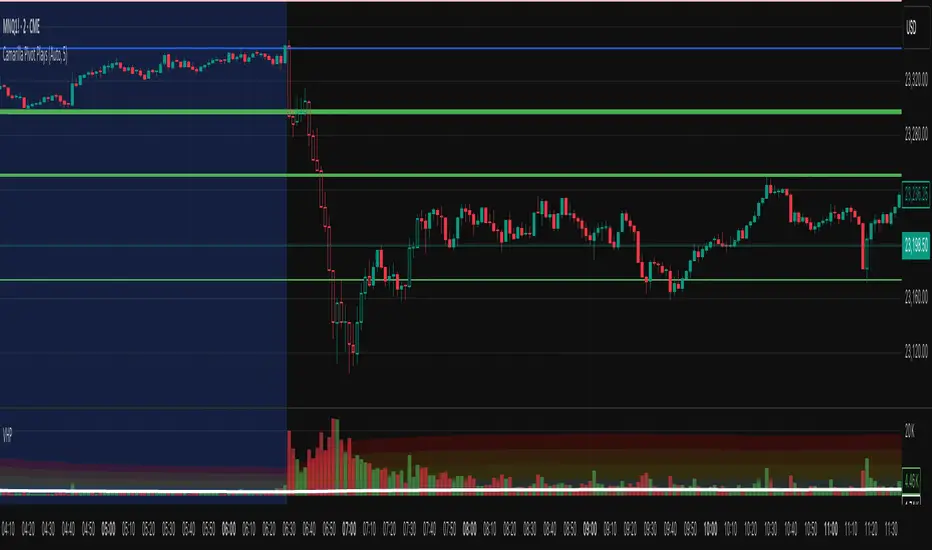
Volume Heatmap Pro - Statistical Volume Analysis Indicator
First and foremost, credit goes to xdecow. You can find the original indicator here:![Heatmap Volume [xdecow]](https://tradingview.sweetlogin.com/proxy-s3/u/unWex8N4_mid.png)
I forked this indicator to make some changes that I wanted (mainly being able to color the volume bars and candlesticks independently).
Overview:
Volume Heatmap Pro is an advanced volume analysis tool that uses statistical analysis to identify significant volume anomalies in real-time. By calculating how many standard deviations the current volume is from its moving average (Z-score), it provides a visual heatmap that instantly highlights unusual volume activity.
Key Features:
📊 Statistical Volume Analysis
- Measures volume using Z-score calculations (standard deviations from mean)
- Dynamically adapts to each instrument's unique volume profile
- Identifies statistically significant volume spikes and drops
🎨 Visual Heatmap System
- Color-coded candlesticks and volume bars based on volume intensity
- Five threshold levels: Extra High (4σ), High (2.5σ), Medium (1σ), Normal (-0.5σ), and Low
- Multiple display modes: backgrounds, lines, or both
- Customizable colors for all threshold levels
⚙️ Flexible Configuration
- Adjustable moving average and standard deviation lengths (default: 610)
- Two color modes: Heatmap (volume-only) or Up/Down (volume + direction)
- Volume bar opacity control
🔔 Smart Alerts
- Set alerts for any threshold level
- Separate alerts for up/down volume bars
- Monitor unusual volume activity across multiple instruments
Use Cases:
- Identify institutional activity and large player participation
- Spot potential breakouts or reversals with volume confirmation
- Monitor volume climax and exhaustion patterns
- Analyze volume trends across different timeframes
- Validate price movements with statistical volume analysis
Perfect For:
Day traders, swing traders, VPA traders, and investors who want to add visual confirmation to their volume analysis and quickly identify when "smart money" is active in the market.
First and foremost, credit goes to xdecow. You can find the original indicator here:
I forked this indicator to make some changes that I wanted (mainly being able to color the volume bars and candlesticks independently).
Overview:
Volume Heatmap Pro is an advanced volume analysis tool that uses statistical analysis to identify significant volume anomalies in real-time. By calculating how many standard deviations the current volume is from its moving average (Z-score), it provides a visual heatmap that instantly highlights unusual volume activity.
Key Features:
📊 Statistical Volume Analysis
- Measures volume using Z-score calculations (standard deviations from mean)
- Dynamically adapts to each instrument's unique volume profile
- Identifies statistically significant volume spikes and drops
🎨 Visual Heatmap System
- Color-coded candlesticks and volume bars based on volume intensity
- Five threshold levels: Extra High (4σ), High (2.5σ), Medium (1σ), Normal (-0.5σ), and Low
- Multiple display modes: backgrounds, lines, or both
- Customizable colors for all threshold levels
⚙️ Flexible Configuration
- Adjustable moving average and standard deviation lengths (default: 610)
- Two color modes: Heatmap (volume-only) or Up/Down (volume + direction)
- Volume bar opacity control
🔔 Smart Alerts
- Set alerts for any threshold level
- Separate alerts for up/down volume bars
- Monitor unusual volume activity across multiple instruments
Use Cases:
- Identify institutional activity and large player participation
- Spot potential breakouts or reversals with volume confirmation
- Monitor volume climax and exhaustion patterns
- Analyze volume trends across different timeframes
- Validate price movements with statistical volume analysis
Perfect For:
Day traders, swing traders, VPA traders, and investors who want to add visual confirmation to their volume analysis and quickly identify when "smart money" is active in the market.
Release Notes
First and foremost, credit goes to xdecow. You can find the original indicator here.I copied his indicator to make some changes that I wanted (mainly being able to color the volume bars and candlesticks independently).
Overview:
Volume Heatmap Pro is an advanced volume analysis tool that uses statistical analysis to identify significant volume anomalies in real-time. By calculating how many standard deviations the current volume is from its moving average (Z-score), it provides a visual heatmap that instantly highlights unusual volume activity.
🎨 Visual Heatmap System
- Color-coded candlesticks and volume bars based on volume intensity
- Five threshold levels: Extra High (4σ), High (2.5σ), Medium (1σ), Normal (-0.5σ), and Low
- Multiple display modes: backgrounds, lines, or both
- Customizable colors for all threshold levels
🔔 Smart Alerts
- Set alerts for any threshold level
- Separate alerts for up/down volume bars
- Monitor unusual volume activity across multiple instruments
Use Cases:
- Identify institutional activity and large player participation
- Spot potential breakouts or reversals with volume confirmation
- Monitor volume climax and exhaustion patterns
- Analyze volume trends across different timeframes
Open-source script
In true TradingView spirit, the creator of this script has made it open-source, so that traders can review and verify its functionality. Kudos to the author! While you can use it for free, remember that republishing the code is subject to our House Rules.
Disclaimer
The information and publications are not meant to be, and do not constitute, financial, investment, trading, or other types of advice or recommendations supplied or endorsed by TradingView. Read more in the Terms of Use.