OPEN-SOURCE SCRIPT
Solar Recent Resistance / Support levels
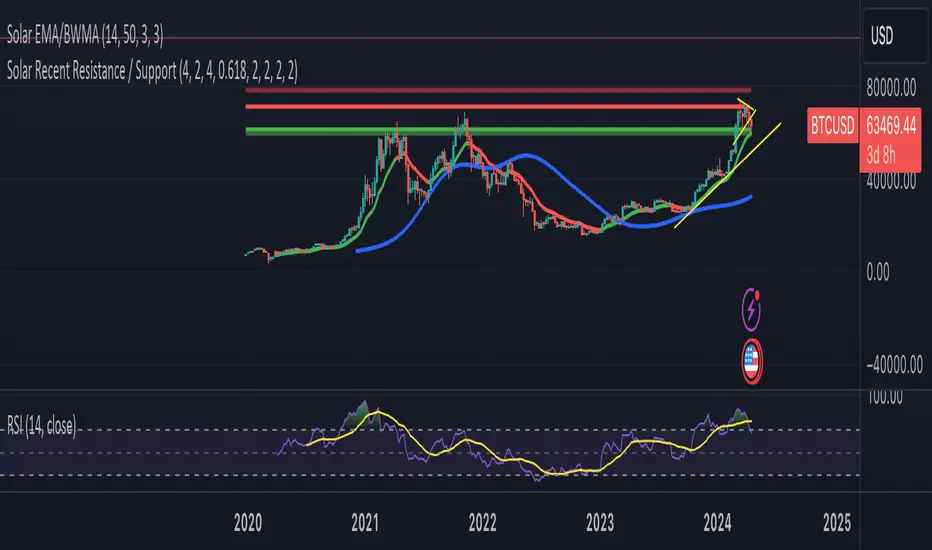
Solar Recent Resistance / Support Indicator
The Solar Recent Resistance / Support indicator is designed to identify recent resistance and support levels based on Fibonacci retracement levels. It helps traders visualize potential price barriers and significant levels where price action may encounter obstacles or find support.
Features:
Fibonacci Levels: The indicator calculates Fibonacci retracement levels based on the specified length and Fibonacci multiplier.
Recent Resistance Line: Displays a trend line representing the most recent resistance level identified by the indicator.
Next Resistance Line: Indicates the next significant resistance level above the current resistance level. The level is calculated based on a multiplier factor.
Recent Support Line: Shows a trend line denoting the most recent support level identified by the indicator.
Previous Support Line: Represents the support level before the current support, aiding in identifying historical support zones.
Usage:
Traders can use the indicator to identify potential areas of price reversal or consolidation.
The recent resistance and support lines can act as reference points for setting profit targets and stop-loss levels.
The next resistance line provides insight into potential future price movements, helping traders anticipate market behavior.
Parameters:
Fibonacci Length: Specifies the length of the Fibonacci retracement calculation.
Fibonacci Multiplier: Determines the multiplier factor for calculating the next resistance level.
Line Width: Adjusts the width of the plotted trend lines.
Resistance Color: Sets the color of the resistance lines.
Support Color: Defines the color of the support lines.
Fibonacci Level: Specifies the Fibonacci level used in the calculations.
Show Resistance Line: Enables or disables the display of resistance lines.
Show Support Line: Enables or disables the display of support lines.
Note:
Adjust the Fibonacci multiplier value to ensure that the next resistance level accurately reflects significant price barriers.
Open-source script
In true TradingView spirit, the creator of this script has made it open-source, so that traders can review and verify its functionality. Kudos to the author! While you can use it for free, remember that republishing the code is subject to our House Rules.
Disclaimer
The information and publications are not meant to be, and do not constitute, financial, investment, trading, or other types of advice or recommendations supplied or endorsed by TradingView. Read more in the Terms of Use.