OPEN-SOURCE SCRIPT
Updated vol_box
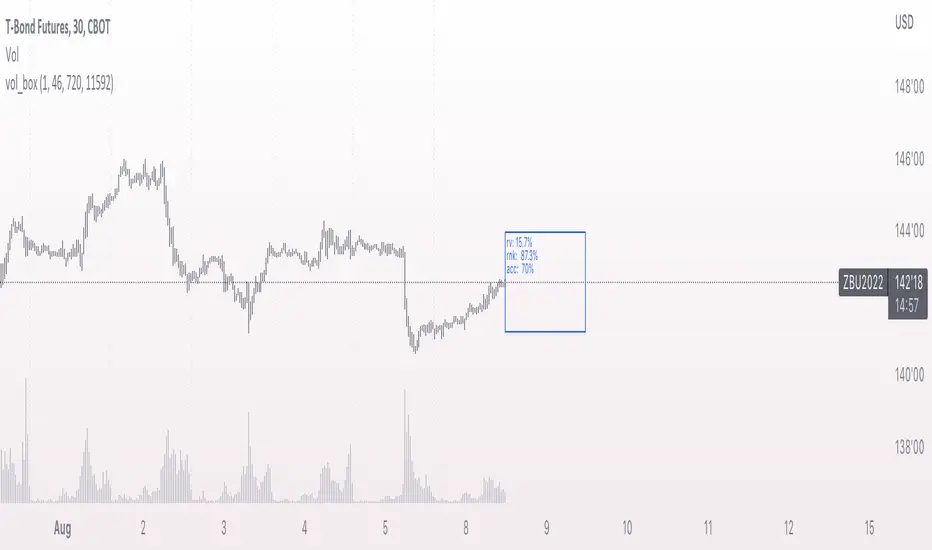
A simple script to draw a realized volatility forecast, in the form of a box. The script calculates realized volatility using the EWMA method, using a number of periods of your choosing. Using the "periods per year", you can adjust the script to work on any time frame. For example, if you are using an hourly chart with bitcoin, there are 24 periods * 365 = 8760 periods per year. This setting is essential for the realized volatility figure to be accurate as an annualized figure, like VIX.
By default, the settings are set to mimic CBOE volatility indices. That is, 252 days per year, and 20 period window on the daily timeframe (simulating a 30 trading day period).
Inside the box are three figures:
1. The current realized volatility.
2. The rank. E.g. "10%" means the current realized volatility is less than 90% of realized volatility measures.
3. The "accuracy": how often price has closed within the box, historically.
Inputs:
stdevs: the number of standard deviations for the box
periods to project: the number of periods to forecast
window: the number of periods for calculating realized volatility
periods per year: the number of periods in one year (e.g. 252 for the "D" timeframe)
Release Notes
fixed rankRelease Notes
- abbreviated termsSome further settings examples:
Financial futures generally trade 23 hours a day. Grain futures trade about 18 hours a day. For a 30 minute chart, projecting 1 day in the future, with a 20 day window for calculating RV, use:
Financials:
periods to project: 46
window: 920
periods per year: 11592
grains:
periods to project: 36
window: 720
periods per year: 9072
Release Notes
cleaned up some extraneous codeRelease Notes
added historical projection lines. if the price closed outside the projection, the nearest bound is colored red. otherwise, blue. by default, these lines are disabled. enable them with the "history" input.Release Notes
fixed typoOpen-source script
In true TradingView spirit, the creator of this script has made it open-source, so that traders can review and verify its functionality. Kudos to the author! While you can use it for free, remember that republishing the code is subject to our House Rules.
Disclaimer
The information and publications are not meant to be, and do not constitute, financial, investment, trading, or other types of advice or recommendations supplied or endorsed by TradingView. Read more in the Terms of Use.
Open-source script
In true TradingView spirit, the creator of this script has made it open-source, so that traders can review and verify its functionality. Kudos to the author! While you can use it for free, remember that republishing the code is subject to our House Rules.
Disclaimer
The information and publications are not meant to be, and do not constitute, financial, investment, trading, or other types of advice or recommendations supplied or endorsed by TradingView. Read more in the Terms of Use.