OPEN-SOURCE SCRIPT
2% candle
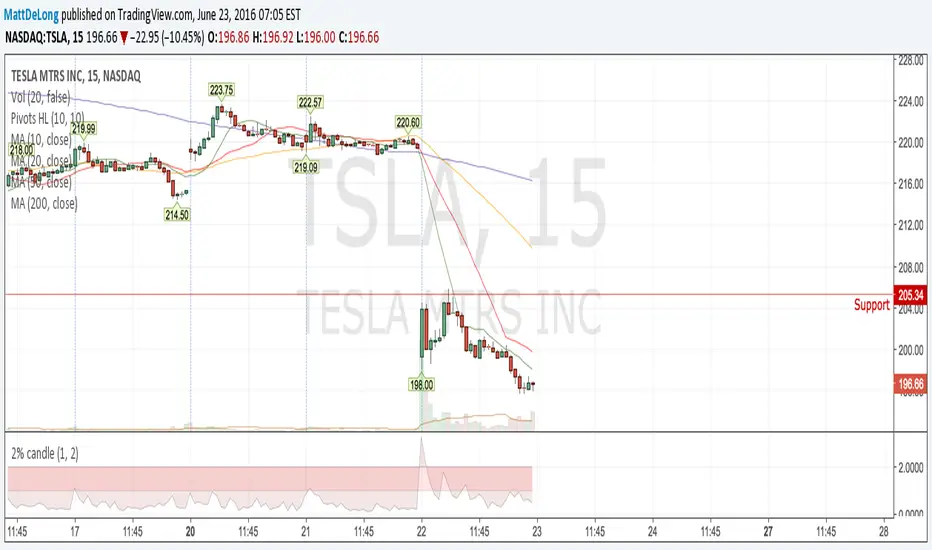
Part of my strategy involves entering a trade based on a candle on a 5-min chart being < 2% (ignoring major volatility).
I got tired of calculating the range of a single candle either in my head or on a calculator, so I wrote this up. Feel free to share it.
Shows the %move of any single candle, default horizontal lines are 1% & 2%, can be changed by clicking the gear icon next to the indicator after you have added the indicator to your chart. Works on any timeframe, 5m, 1h, 1d, etc , obviously
the higher the timeframe, the larger the move.
Open-source script
In true TradingView spirit, the creator of this script has made it open-source, so that traders can review and verify its functionality. Kudos to the author! While you can use it for free, remember that republishing the code is subject to our House Rules.
Disclaimer
The information and publications are not meant to be, and do not constitute, financial, investment, trading, or other types of advice or recommendations supplied or endorsed by TradingView. Read more in the Terms of Use.