OPEN-SOURCE SCRIPT
Updated Color Coded Volume Indicator
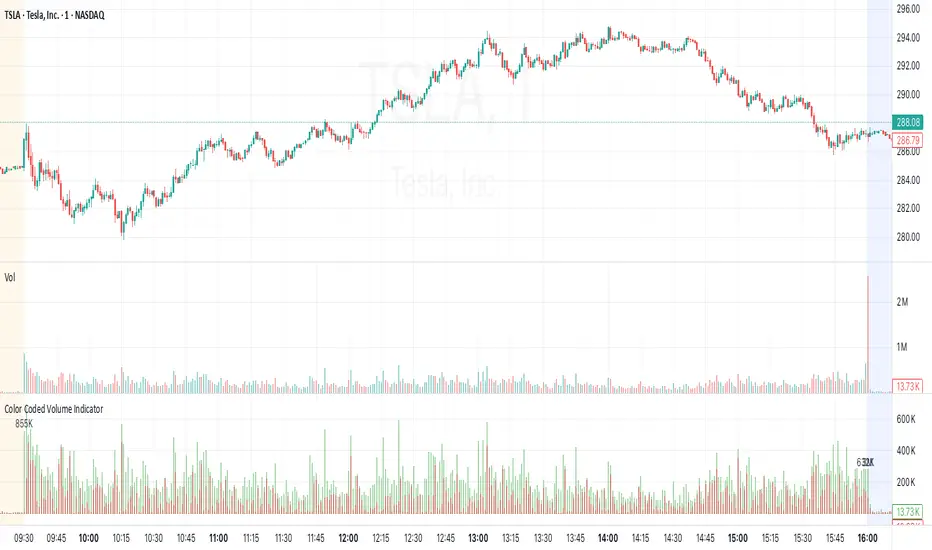
Color Coded Volume Indicator
Overview
Splits each bar’s total volume into estimated buy-side vs. sell-side components and displays them as stacked two-tone columns (red = sell, green = buy). Axis labels and tooltips use “K”/“M” formatting.
Features
How It Works
Usage
Interpretation
Overview
Splits each bar’s total volume into estimated buy-side vs. sell-side components and displays them as stacked two-tone columns (red = sell, green = buy). Axis labels and tooltips use “K”/“M” formatting.
Features
- []Stacked Two-Tone Columns
- []Red Base: estimated sell volume (50% opacity)
[]Green Top: remaining buy volume (50% opacity)
[]Zero Baseline for clean reference at zero
[]Positive-Only Bars (no negatives) - []Red Base: estimated sell volume (50% opacity)
How It Works
- []True-Range Guard
Skips bars where [code]high == low[/code] to avoid divide-by-zero.
[]Volume SplitBuyVol = Volume × (Close − Low) / (High − Low)
SellVol = Volume × (High − Close) / (High − Low)
Both series clamped ≥ 0. - Layered Plot
Draw semi-transparent green at full height, then overlay red sell portion.
Usage
- []Open TradingView’s Pine Editor
[]Paste in the full script
[]Click “Save & Add to Chart”
[]In the Publish dialog, title it “Color Coded Volume Indicator” and paste this description.
Interpretation
- []Green-dominant bars → strong buying pressure
[]Red-dominant bars → strong selling pressure - Equal halves → balanced activity
Release Notes
Added Normalize volume on opening and closing candles to reduce the size of the opening and closing candles, which almost always are unusually large, but don't add a lot of value to most users. When you normalize, it reduces their size and adds a text label to still show you the size.Release Notes
Color Coded Volume IndicatorNormalize session extremes to 15:58 volume
This indicator splits each bar's volume into buy (green) and sell (red) components and, optionally, normalizes the first and last two session candles to the previous-1 bar's volume (i.e. the 15:58 bar on a 1-min chart).
Use on intraday charts up to 5-min. When Normalize volume on session extremes to 15:58 volume is enabled, the 9:30, 15:59, and 16:00 bars plot at the 15:58 volume level, preserving each bar's original buy/sell ratio. Labels show the actual raw volume (K/M format).
- InputsNormalize volume on session extremes to 15:58 volume (bool): Enable cap on 9:30, 15:59 & 16:00 bars
- Volume SplitBuy volume = max(volume * (close - low) / (high - low), 0)
Sell volume = max(volume * (high - close) / (high - low), 0) - Normalization LogicDetect 15:58 candle → latch its rawTotal as reference
Session extremes = 9:30, 15:59, 16:00 bars
On extremes: plot total = reference; plot sell = reference * (sell/total)
All other bars: plot actual rawTotal/split - Labels
- Plain text (no box) above each extreme bar
- Shows actual raw volume in K/M format
- Plain text (no box) above each extreme bar
Release Notes
Color Coded Volume IndicatorNormalize session extremes to 15:58 volume
This indicator splits each bar's volume into buy (green) and sell (red) components and, optionally, normalizes the first and last two session candles to the previous-1 bar's volume (i.e. the 15:58 bar on a 1-min chart).
Use on intraday charts up to 5-min. When Normalize volume on session extremes to 15:58 volume is enabled, the 9:30, 15:59, and 16:00 bars plot at the 15:58 volume level, preserving each bar's original buy/sell ratio. Labels show the actual raw volume (K/M format).
- InputsNormalize volume on session extremes to 15:58 volume (bool): Enable cap on 9:30, 15:59 & 16:00 bars
- Volume SplitBuy volume = max(volume * (close - low) / (high - low), 0)
Sell volume = max(volume * (high - close) / (high - low), 0) - Normalization LogicDetect 15:58 candle → latch its rawTotal as reference
Session extremes = 9:30, 15:59, 16:00 bars
On extremes: plot total = reference; plot sell = reference * (sell/total)
All other bars: plot actual rawTotal/split - Labels
- Plain text (no box) above each extreme bar
- Shows actual raw volume in K/M format
- Plain text (no box) above each extreme bar
Open-source script
In true TradingView spirit, the creator of this script has made it open-source, so that traders can review and verify its functionality. Kudos to the author! While you can use it for free, remember that republishing the code is subject to our House Rules.
Disclaimer
The information and publications are not meant to be, and do not constitute, financial, investment, trading, or other types of advice or recommendations supplied or endorsed by TradingView. Read more in the Terms of Use.