OPEN-SOURCE SCRIPT
UVOL / DVOL Ratio
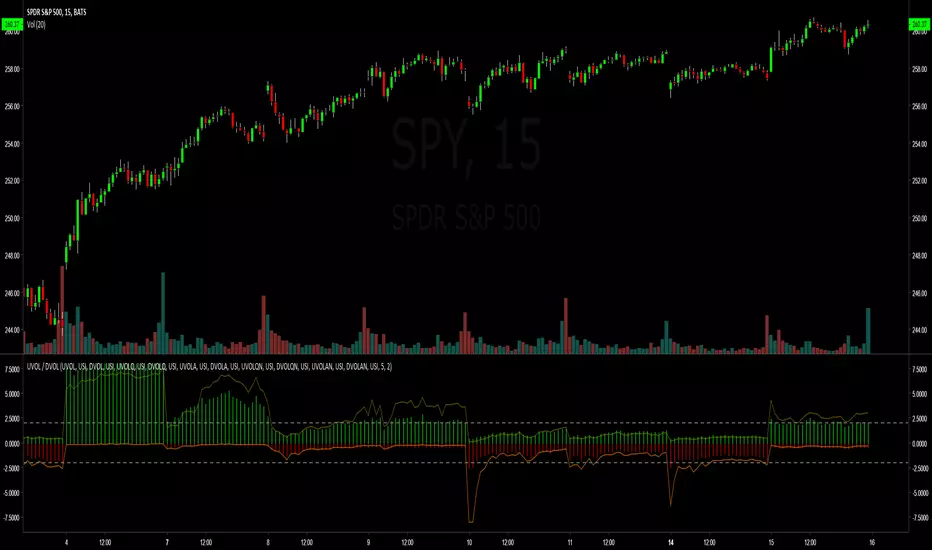
Plots the NYSE, NASDAQ, AMEX UP Volume and DOWN Volume ratios as a histogram - and adds the index UVOL / DVOL ratios as a line graph.
DVOL is represented as negative - UVOL as positive. When either is above 2 its a good predictor of the day's outcome. At least - it tells you if the bulls or bears are winning the day.
Really simple to use / edit to your needs
Enjoy
DVOL is represented as negative - UVOL as positive. When either is above 2 its a good predictor of the day's outcome. At least - it tells you if the bulls or bears are winning the day.
Really simple to use / edit to your needs
Enjoy
Open-source script
In true TradingView spirit, the creator of this script has made it open-source, so that traders can review and verify its functionality. Kudos to the author! While you can use it for free, remember that republishing the code is subject to our House Rules.
Disclaimer
The information and publications are not meant to be, and do not constitute, financial, investment, trading, or other types of advice or recommendations supplied or endorsed by TradingView. Read more in the Terms of Use.