OPEN-SOURCE SCRIPT
SARC
This indicator aims to indicate the correlation between two assets(Current and Base), it does NOT show entries or help your chart analysis directly.
The main features of this Correlation indicator is :
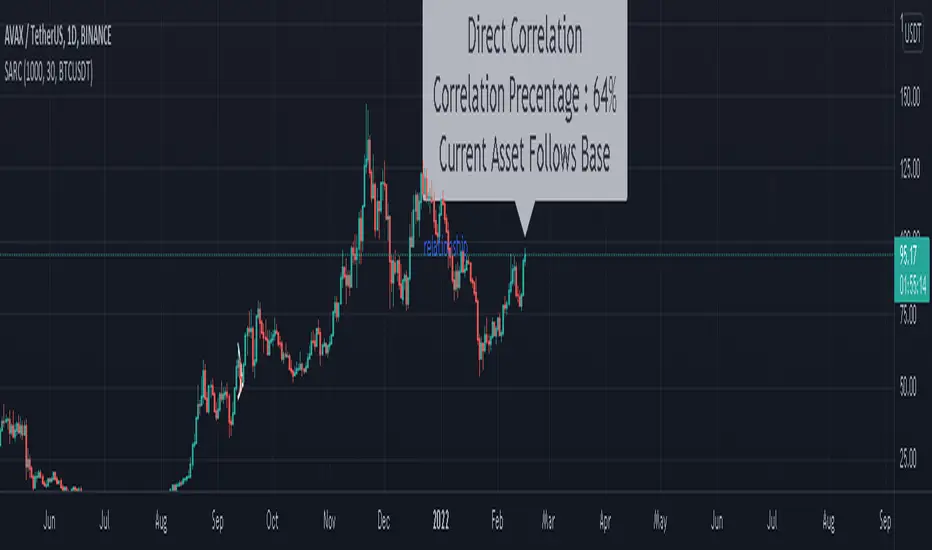
Correlation type : Direct Correlation | Inverse Correlation | No Correlation
Correlation Percentage : as its name, it calculate the Correlation Percentage between Current and base assets if exist
Correlation Leader : If there is a correlation , it indicates which asset follows the other (Current Asset Follows Base | Base Follows Current Asset)
Correlation bars : if the box (Show Correlation Candles) on the settings was True, it will show GREEN lines above candles which have direct correlation and RED lines above candles which have inverse correlation
How to use: Chose the base asset (default: bitcoin) and open any other chart to be the other -Current- asset
inputs:
Note: this indicator uses every single candle and compare it to the base same time candle, after some time I will post another similar indicator, BUT the new one will use the whole direction of the assets instead of each candle alone, I hope one of them can help you.
For any notes on the indicator to be edited, or for another indicator ideas please comment.
The main features of this Correlation indicator is :
Correlation type : Direct Correlation | Inverse Correlation | No Correlation
Correlation Percentage : as its name, it calculate the Correlation Percentage between Current and base assets if exist
Correlation Leader : If there is a correlation , it indicates which asset follows the other (Current Asset Follows Base | Base Follows Current Asset)
Correlation bars : if the box (Show Correlation Candles) on the settings was True, it will show GREEN lines above candles which have direct correlation and RED lines above candles which have inverse correlation
How to use: Chose the base asset (default: bitcoin) and open any other chart to be the other -Current- asset
inputs:
- *Max Lookback length : how many candles will be included in the scan.
*Correlation Factor : how stronger the correlation should be to include the candle(E.g. if set to 50, if any candle correlation was less than 50 it will be ignored), If you are confused leave it as its default.
*Base Asset : The base asset to calculate the current asset correlation with.
*Show Correlation Candles : (True | false) explained above on the main features.
Note: this indicator uses every single candle and compare it to the base same time candle, after some time I will post another similar indicator, BUT the new one will use the whole direction of the assets instead of each candle alone, I hope one of them can help you.
For any notes on the indicator to be edited, or for another indicator ideas please comment.
Open-source script
In true TradingView spirit, the creator of this script has made it open-source, so that traders can review and verify its functionality. Kudos to the author! While you can use it for free, remember that republishing the code is subject to our House Rules.
Disclaimer
The information and publications are not meant to be, and do not constitute, financial, investment, trading, or other types of advice or recommendations supplied or endorsed by TradingView. Read more in the Terms of Use.