OPEN-SOURCE SCRIPT
NAIFCHART_Osc+ ST+sqzmom
# NAIFCHART Multi-Component Indicator: Trading Analysis Guide
## Overview
The NAIFCHART Osc+ ST+sqzmom indicator combines three proven technical analysis tools into a unified trading system. This indicator was developed and shared by the trading community at t.me/cryptomena1, providing traders with comprehensive market analysis through integrated momentum, trend, and volatility assessment.
## Core Components
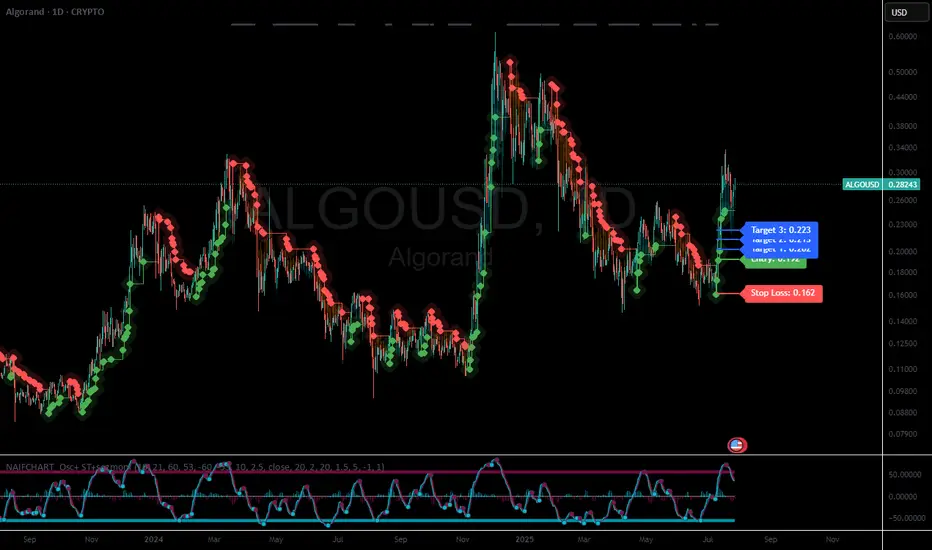
**Wave Trend Oscillator**: Identifies overbought and oversold conditions using exponential moving averages. Key levels include overbought zones at 60 and 53, with oversold areas at -60 and -53. Crossover signals between the two oscillator lines generate entry opportunities, displayed as colored circles on the chart.
**Supertrend Indicator**: Determines market direction using Average True Range calculations with a 2.5 factor and 10-period ATR. Green lines indicate uptrends while red lines signal downtrends. The indicator adapts to market volatility, providing reliable trend identification across different market conditions.
**Squeeze Momentum**: Compares Bollinger Bands with Keltner Channels to identify consolidation periods and breakouts. Black squares indicate squeeze conditions (low volatility), green triangles signal upward breakouts, and red triangles mark downward breakouts.
## Trading Signals
**Long Entry Signals**: Green triangles from Squeeze Momentum, Supertrend line turning green, and bullish crossovers in Wave Trend Oscillator from oversold levels.
**Short Entry Signals**: Red triangles from Squeeze Momentum, Supertrend line turning red, and bearish crossovers in Wave Trend Oscillator from overbought levels.
## Risk Management Features
The indicator automatically calculates risk management levels using ATR-based calculations. Stop losses are positioned at 3x ATR distance, while three progressive take profit targets are set at 1x, 2x, and 3x ATR multiples. All levels are clearly displayed on the chart with colored lines and labels.
When trend direction changes, previous levels are automatically cleared and new calculations are generated, ensuring current market conditions are reflected in all risk parameters.
## Alert System
Comprehensive alerts include trend changes with complete trade setup details, squeeze release notifications for breakout opportunities, and trend weakness warnings for position management. Alert messages contain trading pair information, timeframe data, and all relevant entry and exit levels.
## Implementation Guidelines
**Timeframe Selection**: Higher timeframes (4-hour, daily) provide reliable signals for position trading. One-hour charts work well for day trading, while 15-30 minute timeframes enable scalping with enhanced risk management requirements.
**Risk Management**: Limit risk to 1-2% of capital per trade using the calculated stop loss levels for position sizing. Implement partial profit-taking at each target level while adjusting stops to protect gains.
**Market Adaptation**: The indicator's ATR-based calculations automatically adjust to market volatility. During high volatility periods, levels widen appropriately, while low volatility conditions result in tighter risk management parameters.
## Best Practices
Combine indicator signals with key support and resistance analysis for enhanced validation. Monitor volume to confirm breakout strength, particularly when Squeeze Momentum signals develop. Maintain awareness of economic events that may influence market behavior independent of technical signals.
The multi-component design provides internal confirmation through multiple signal alignment requirements, reducing false signals while maintaining reasonable trade frequency for active strategies.
## Community Resources
Access ongoing education and strategy discussions through the source community at t.me/cryptomena1, where traders share market analysis and optimization techniques for this indicator system.
## Conclusion
The NAIFCHART indicator offers a systematic approach to market analysis through proven technical components. Success requires understanding each element's functionality and implementing proper risk management principles. The community-driven development ensures practical relevance and ongoing support for traders seeking comprehensive market analysis tools.
Practice with demo accounts before live implementation to develop familiarity with signal interpretation and trade management procedures. The indicator's systematic approach reduces emotional decision-making while providing clear guidelines for entry, management, and exit strategies across various market conditions.
## Overview
The NAIFCHART Osc+ ST+sqzmom indicator combines three proven technical analysis tools into a unified trading system. This indicator was developed and shared by the trading community at t.me/cryptomena1, providing traders with comprehensive market analysis through integrated momentum, trend, and volatility assessment.
## Core Components
**Wave Trend Oscillator**: Identifies overbought and oversold conditions using exponential moving averages. Key levels include overbought zones at 60 and 53, with oversold areas at -60 and -53. Crossover signals between the two oscillator lines generate entry opportunities, displayed as colored circles on the chart.
**Supertrend Indicator**: Determines market direction using Average True Range calculations with a 2.5 factor and 10-period ATR. Green lines indicate uptrends while red lines signal downtrends. The indicator adapts to market volatility, providing reliable trend identification across different market conditions.
**Squeeze Momentum**: Compares Bollinger Bands with Keltner Channels to identify consolidation periods and breakouts. Black squares indicate squeeze conditions (low volatility), green triangles signal upward breakouts, and red triangles mark downward breakouts.
## Trading Signals
**Long Entry Signals**: Green triangles from Squeeze Momentum, Supertrend line turning green, and bullish crossovers in Wave Trend Oscillator from oversold levels.
**Short Entry Signals**: Red triangles from Squeeze Momentum, Supertrend line turning red, and bearish crossovers in Wave Trend Oscillator from overbought levels.
## Risk Management Features
The indicator automatically calculates risk management levels using ATR-based calculations. Stop losses are positioned at 3x ATR distance, while three progressive take profit targets are set at 1x, 2x, and 3x ATR multiples. All levels are clearly displayed on the chart with colored lines and labels.
When trend direction changes, previous levels are automatically cleared and new calculations are generated, ensuring current market conditions are reflected in all risk parameters.
## Alert System
Comprehensive alerts include trend changes with complete trade setup details, squeeze release notifications for breakout opportunities, and trend weakness warnings for position management. Alert messages contain trading pair information, timeframe data, and all relevant entry and exit levels.
## Implementation Guidelines
**Timeframe Selection**: Higher timeframes (4-hour, daily) provide reliable signals for position trading. One-hour charts work well for day trading, while 15-30 minute timeframes enable scalping with enhanced risk management requirements.
**Risk Management**: Limit risk to 1-2% of capital per trade using the calculated stop loss levels for position sizing. Implement partial profit-taking at each target level while adjusting stops to protect gains.
**Market Adaptation**: The indicator's ATR-based calculations automatically adjust to market volatility. During high volatility periods, levels widen appropriately, while low volatility conditions result in tighter risk management parameters.
## Best Practices
Combine indicator signals with key support and resistance analysis for enhanced validation. Monitor volume to confirm breakout strength, particularly when Squeeze Momentum signals develop. Maintain awareness of economic events that may influence market behavior independent of technical signals.
The multi-component design provides internal confirmation through multiple signal alignment requirements, reducing false signals while maintaining reasonable trade frequency for active strategies.
## Community Resources
Access ongoing education and strategy discussions through the source community at t.me/cryptomena1, where traders share market analysis and optimization techniques for this indicator system.
## Conclusion
The NAIFCHART indicator offers a systematic approach to market analysis through proven technical components. Success requires understanding each element's functionality and implementing proper risk management principles. The community-driven development ensures practical relevance and ongoing support for traders seeking comprehensive market analysis tools.
Practice with demo accounts before live implementation to develop familiarity with signal interpretation and trade management procedures. The indicator's systematic approach reduces emotional decision-making while providing clear guidelines for entry, management, and exit strategies across various market conditions.
Open-source script
In true TradingView spirit, the creator of this script has made it open-source, so that traders can review and verify its functionality. Kudos to the author! While you can use it for free, remember that republishing the code is subject to our House Rules.
Quant Trader | Crypto
Disclaimer
The information and publications are not meant to be, and do not constitute, financial, investment, trading, or other types of advice or recommendations supplied or endorsed by TradingView. Read more in the Terms of Use.