OPEN-SOURCE SCRIPT
[LeonidasCrypto]EMA with Volatility Glow
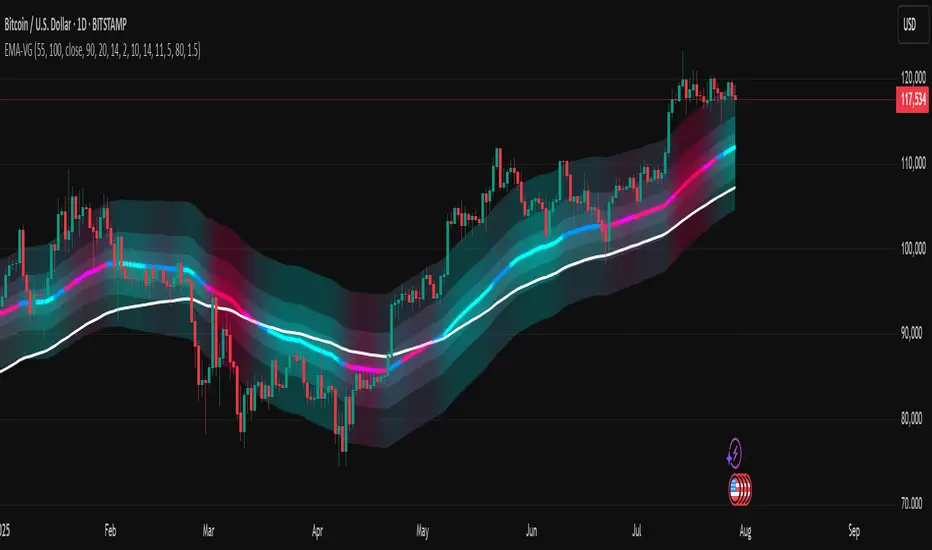
EMA Volatility Glow - Advanced Moving Average with Dynamic Volatility Visualization
Overview
The EMA Volatility Glow indicator combines dual exponential moving averages with a sophisticated volatility measurement system, enhanced by dynamic visual effects that respond to real-time market conditions.
Technical Components
Volatility Calculation Engine
BB Volatility Curve: Utilizes Bollinger Band width normalized through RSI smoothing
Multi-stage Noise Filtering: 3-layer exponential smoothing algorithm reduces market noise
Rate of Change Analysis: Dual-timeframe RoC calculation (14/11 periods) processed through weighted moving average
Dynamic Normalization: 100-period lookback for relative volatility assessment
Moving Average System
Primary EMA: Default 55-period exponential moving average with volatility-responsive coloring
Secondary EMA: Default 100-period exponential moving average for trend confirmation
Trend Analysis: Real-time bullish/bearish determination based on EMA crossover dynamics
Visual Enhancement Framework
Gradient Band System: Multi-layer volatility bands using Fibonacci ratios (0.236, 0.382, 0.618)
Dynamic Color Mapping: Five-tier color system reflecting volatility intensity levels
Configurable Glow Effects: Customizable transparency and intensity settings
Trend Fill Visualization: Directional bias indication between moving averages
Key Features
Volatility States:
Ultra-Low: Minimal market movement periods
Low: Reduced volatility environments
Medium: Normal market conditions
High: Increased volatility phases
Extreme: Exceptional market stress periods
Customization Options:
Adjustable EMA periods
Configurable glow intensity (1-10 levels)
Variable transparency controls
Toggleable visual components
Customizable gradient band width
Technical Calculations:
ATR-based gradient bands with noise filtering
ChartPrime-inspired multi-layer fill system
Real-time volatility curve computation
Smooth color gradient transitions
Applications
Trend Identification: Dual EMA system for directional bias assessment
Volatility Analysis: Real-time market stress evaluation
Risk Management: Visual volatility cues for position sizing decisions
Market Timing: Enhanced visual feedback for entry/exit consideration
Open-source script
In true TradingView spirit, the creator of this script has made it open-source, so that traders can review and verify its functionality. Kudos to the author! While you can use it for free, remember that republishing the code is subject to our House Rules.
Trading for living!
Disclaimer
The information and publications are not meant to be, and do not constitute, financial, investment, trading, or other types of advice or recommendations supplied or endorsed by TradingView. Read more in the Terms of Use.