OPEN-SOURCE SCRIPT
Updated DS Gurukul Roundup
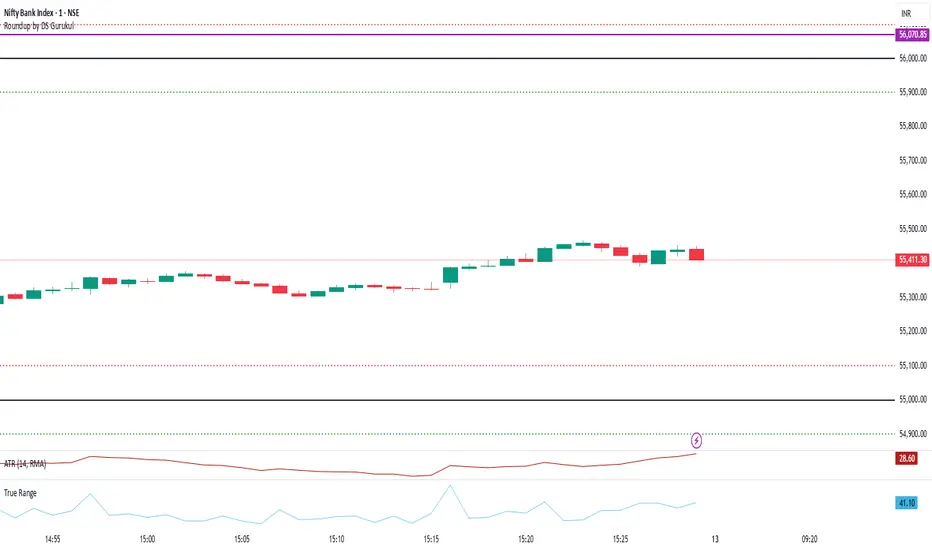
Roundup (Support & Resistance Indicator) For Bank Nifty
By DS Gurukul
To be used only for Bank Nifty.
Indicator Overview
The Round Figure Indicator identifies key psychological support and resistance levels based on round numbers. These levels often act as strong turning points in price action due to trader psychology and institutional order placement.
How It Works
Key Levels:
Mid Band (Black Solid Line): Major round number
Upper Band (Green Solid Line): Mid Band (resistance)
Lower Band (Red Solid Line): Mid Band (support)
Sub-Bands (Dotted Lines): ±100 levels for tighter zones
Alerts: Triggers when price touches any band, signaling potential reversals or breakouts.
Trading Strategy
✅ Bounce Trades:
Buy near Lower Band or Mid Sub-Lower with bullish confirmation (e.g., hammer candle).
Sell near Upper Band or Mid Sub-Upper with bearish rejection (e.g., shooting star).
✅ Breakout Trades:
Enter long on a close above Upper Band with volume.
Enter short on a close below Lower Band with momentum.
⚠️ Risk Management:
Place stops just beyond the opposite sub-band.
Avoid trading if price is stuck between mid/sub-bands (choppy market).
Why It Works
Round numbers attract limit orders (support/resistance).
Institutions use these levels for stop placements and profit targets.
Works across all timeframes (scalping to swing trading).
🔔 Tip: Combine with RSI/MACD for higher-probability trades!
Release Notes
Roundup (Support & Resistance Indicator) For Bank NiftyBy DS Gurukul
To be used only for Bank Nifty.
Indicator Overview
The Round Figure Indicator identifies key psychological support and resistance levels based on round numbers (e.g., 53000, 54000). These levels often act as strong turning points in price action due to trader psychology and institutional order placement.
How It Works
Key Levels:
Mid Band (Black Solid Line): Major round number
Upper Band (Green Solid Line): Mid Band (resistance)
Lower Band (Red Solid Line): Mid Band (support)
Sub-Bands (Dotted Lines): ±100 levels for tighter zones
Alerts: Triggers when price touches any band, signaling potential reversals or breakouts.
Trading Strategy
✅ Bounce Trades:
Buy near Lower Band or Mid Sub-Lower with bullish confirmation (e.g., hammer candle).
Sell near Upper Band or Mid Sub-Upper with bearish rejection (e.g., shooting star).
✅ Breakout Trades:
Enter long on a close above Upper Band with volume.
Enter short on a close below Lower Band with momentum.
⚠️ Risk Management:
Place stops just beyond the opposite sub-band.
Avoid trading if price is stuck between mid/sub-bands (choppy market).
Why It Works
Round numbers attract limit orders (support/resistance).
Institutions use these levels for stop placements and profit targets.
Works across all timeframes (scalping to swing trading).
🔔 Tip: Combine with RSI/MACD for higher-probability trades!
Release Notes
Roundup (Support & Resistance Indicator) For Bank NiftyBy DS Gurukul
To be used only for Bank Nifty.
Indicator Overview
The Round Figure Indicator identifies key psychological support and resistance levels based on round numbers. These levels often act as strong turning points in price action due to trader psychology and institutional order placement.
How It Works
Key Levels:
Mid Band (Black Solid Line): Major round number
Upper Band (Green Solid Line): Mid Band (resistance)
Lower Band (Red Solid Line): Mid Band (support)
Sub-Bands (Dotted Lines): ±100 levels for tighter zones
Alerts: Triggers when price touches any band, signaling potential reversals or breakouts.
Trading Strategy
✅ Bounce Trades:
Buy near Lower Band or Mid Sub-Lower with bullish confirmation (e.g., hammer candle).
Sell near Upper Band or Mid Sub-Upper with bearish rejection (e.g., shooting star).
✅ Breakout Trades:
Enter long on a close above Upper Band with volume.
Enter short on a close below Lower Band with momentum.
⚠️ Risk Management:
Place stops just beyond the opposite sub-band.
Avoid trading if price is stuck between mid/sub-bands (choppy market).
Why It Works
Round numbers attract limit orders (support/resistance).
Institutions use these levels for stop placements and profit targets.
Works across all timeframes (scalping to swing trading).
🔔 Tip: Combine with RSI/MACD for higher-probability trades!
Release Notes
Roundup (Support & Resistance Indicator) For Bank NiftyBy DS Gurukul
Version : 3.0
To be used only for Bank Nifty.
Indicator Overview
The Round Figure Indicator identifies key psychological support and resistance levels based on round numbers. These levels often act as strong turning points in price action due to trader psychology and institutional order placement.
How It Works
Key Levels:
Mid Band (Black Solid Line): Major round number
Upper Band (Green Solid Line): Mid Band (resistance)
Lower Band (Red Solid Line): Mid Band (support)
Sub-Bands (Dotted Lines): ±100 levels for tighter zones
Alerts: Triggers when price touches any band, signaling potential reversals or breakouts.
Trading Strategy
✅ Bounce Trades:
Buy near Lower Band or Mid Sub-Lower with bullish confirmation (e.g., hammer candle).
Sell near Upper Band or Mid Sub-Upper with bearish rejection (e.g., shooting star).
✅ Breakout Trades:
Enter long on a close above Upper Band with volume.
Enter short on a close below Lower Band with momentum.
⚠️ Risk Management:
Place stops just beyond the opposite sub-band.
Avoid trading if price is stuck between mid/sub-bands (choppy market).
Why It Works
Round numbers attract limit orders (support/resistance).
Institutions use these levels for stop placements and profit targets.
Works across all timeframes (scalping to swing trading).
🔔 Tip: Combine with RSI/MACD for higher-probability trades!
Open-source script
In true TradingView spirit, the creator of this script has made it open-source, so that traders can review and verify its functionality. Kudos to the author! While you can use it for free, remember that republishing the code is subject to our House Rules.
Disclaimer
The information and publications are not meant to be, and do not constitute, financial, investment, trading, or other types of advice or recommendations supplied or endorsed by TradingView. Read more in the Terms of Use.