OPEN-SOURCE SCRIPT
Updated Dev's PDH PDL super strategy
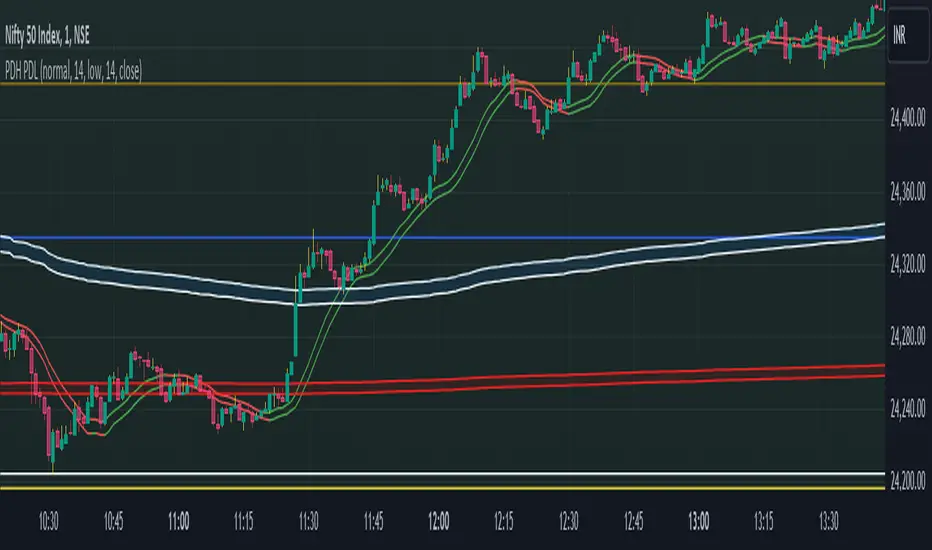
Have plotted Previous day High, previous day low, previous day close and previous day open. Moreover Previous month High and low are plotted. Background changes are made as per this concept: when the current day's price is above PDL and below PDH, a green background when the current price is above both PDL and PDH, and a red background when the current day's price is below both PDL and PDH.
Current day High and low are plotted as white lines, which are dynamic and change once new high or low forms.
Current day High and low are plotted as white lines, which are dynamic and change once new high or low forms.
Release Notes
Added sma and current day's openRelease Notes
Added vwap cloudsOpen-source script
In true TradingView spirit, the creator of this script has made it open-source, so that traders can review and verify its functionality. Kudos to the author! While you can use it for free, remember that republishing the code is subject to our House Rules.
Disclaimer
The information and publications are not meant to be, and do not constitute, financial, investment, trading, or other types of advice or recommendations supplied or endorsed by TradingView. Read more in the Terms of Use.
Open-source script
In true TradingView spirit, the creator of this script has made it open-source, so that traders can review and verify its functionality. Kudos to the author! While you can use it for free, remember that republishing the code is subject to our House Rules.
Disclaimer
The information and publications are not meant to be, and do not constitute, financial, investment, trading, or other types of advice or recommendations supplied or endorsed by TradingView. Read more in the Terms of Use.