OPEN-SOURCE SCRIPT
RSI Disparity Signal
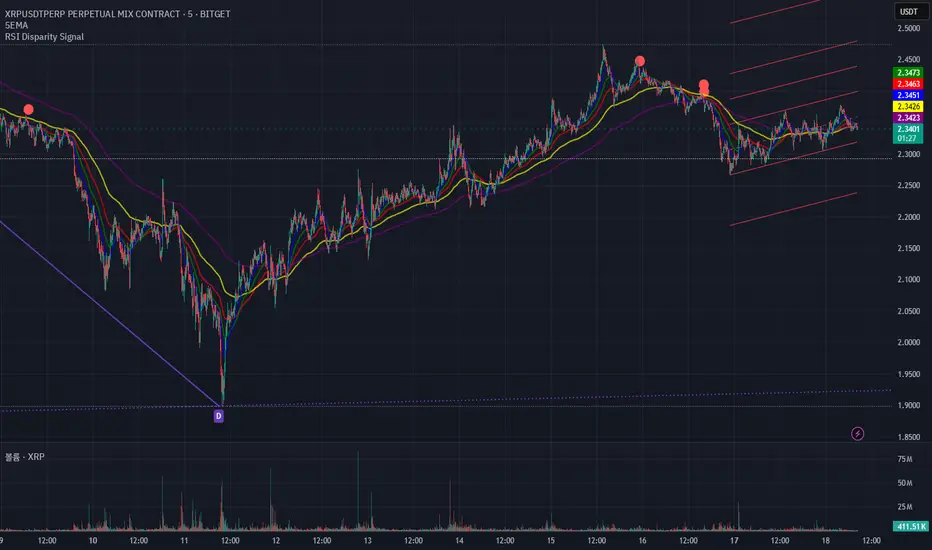
RSI Disparity Signal Indicator
Overview:
This TradingView indicator detects when the RSI is significantly lower than its RSI-based moving average (RSI MA). Whenever the RSI is 20 points or more below the RSI MA, a signal (red dot) appears above the corresponding candlestick.
How It Works:
Calculates RSI using the default 14-period setting.
Calculates the RSI-based Moving Average (RSI MA) using a 14-period simple moving average (SMA).
Measures the disparity between the RSI and its MA.
Generates a signal when the RSI is 20 points or more below the RSI MA.
Plots a red circle above the candlestick whenever this condition is met.
Customization:
You can modify the RSI length and MA period to fit your trading strategy.
Change the plotshape() style to use different symbols like triangles or arrows.
Adjust the disparity threshold (currently set at 20) to make the signal more or less sensitive.
Use Case:
This indicator can help identify potentially oversold conditions where RSI is significantly below its average, signaling possible price reversals.
Open-source script
In true TradingView spirit, the creator of this script has made it open-source, so that traders can review and verify its functionality. Kudos to the author! While you can use it for free, remember that republishing the code is subject to our House Rules.
Disclaimer
The information and publications are not meant to be, and do not constitute, financial, investment, trading, or other types of advice or recommendations supplied or endorsed by TradingView. Read more in the Terms of Use.