OPEN-SOURCE SCRIPT
WT_BTC_Dow Jones_2019[wozdux]
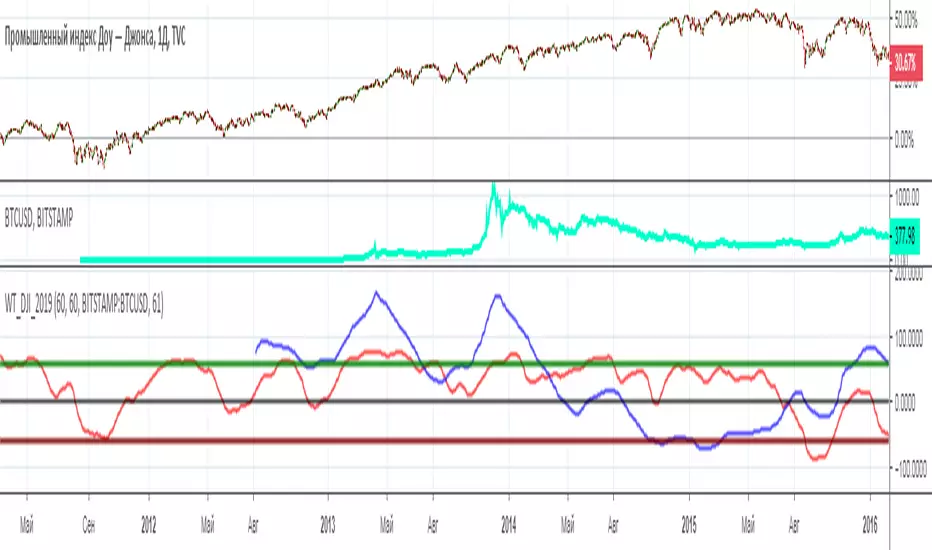
Comparison of two trading instruments using the indicator. Visual comparison often does not provide complete information. The scale and amplitude of the fluctuations of the two trading pairs are very different. Therefore, it is better to compare indicators from these pairs. I have used for this purpose, the speed indicator of price movement wt. The red line is the wt indicator from the trading instrument that is in the main window. The blue line is an indicator from the pair, which is written in the indicator settings. In addition, the calculation periods for each pair can be taken as the same or different. Often, trading pairs do not fluctuate synchronously, so it is necessary to select the periods of calculation of the wt indicator individually. In this example, Dow Jones and bitcoin were used.
-----------------------
Сравнение двух торговых инструментов с помощью индикатора. Визуальное сравнение часто не дает полной информации. Масштаб и амплитуда колебаний двух торговых пар бывают сильно различаются. Поэтому сравнивать лучше индикаторы от данных пар. Я использовала для этой цели индикатор скорости движения цены wt. Красная линия это индикатор wt от того торгового инструмента, который находится в главном окне. Синяя линия это индикатор от пары, которая прописывается в настройках индикатора. Кроме того, периоды вычислений для каждой пары можно брать как одинаковые, так и разные. Часто торговые пары колеблются не синхронно, поэтому стоит подбирать периоды вычислений индикатора WT индивидуально. В данном примере использовался Доу Джонс и биткоин.
Open-source script
In true TradingView spirit, the creator of this script has made it open-source, so that traders can review and verify its functionality. Kudos to the author! While you can use it for free, remember that republishing the code is subject to our House Rules.
Disclaimer
The information and publications are not meant to be, and do not constitute, financial, investment, trading, or other types of advice or recommendations supplied or endorsed by TradingView. Read more in the Terms of Use.