OPEN-SOURCE SCRIPT
NVT Z-Score
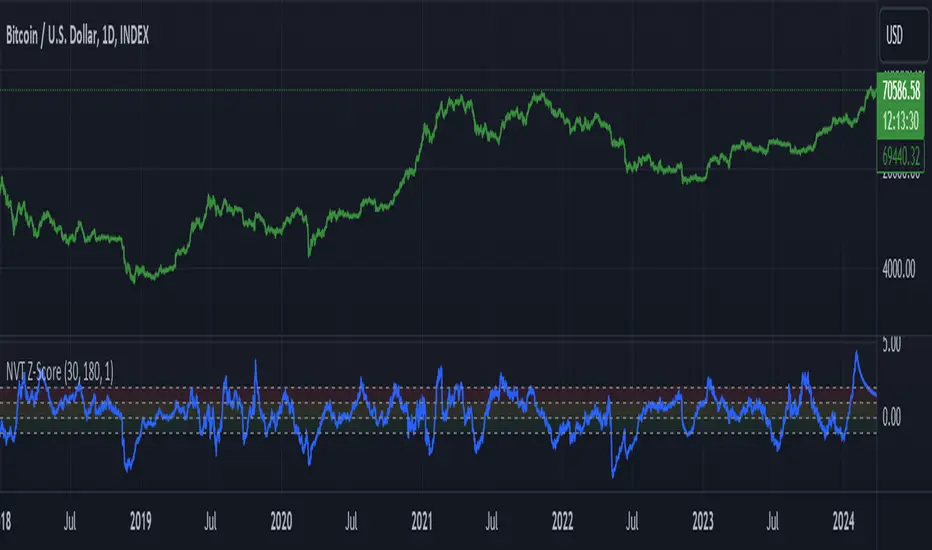
NVT Z-Score Script:
Data Source and Calculation: This script calculates the NVT ratio by dividing the market cap (assumed from QUANDL data) by a 90-day MA of the transaction volume (also from QUANDL), similar to the NVTS calculation. However, the adaptation lies in further analyzing the NVT ratio through a Z-score approach, not explicitly described in the original NVTS methodology.
Z-Score Analysis: The script calculates the mean and standard deviation of the NVT ratio over a user-defined period (daysForMean, defaulting to 180 days) and then computes the Z-score of the current NVT ratio relative to this historical data. This Z-score analysis introduces a standardized way of understanding the NVT ratio's deviation from its historical average, offering a nuanced view of market valuation states.
Visualization and Dynamic Zones: The visualization emphasizes Z-score-based dynamic zones (green, yellow, and red), determined by the stdDevMultiplier. These zones are plotted and filled on the chart, providing visual cues for interpreting the NVT ratio's current state in relation to its historical norm. This aspect significantly differs from the traditional NVTS approach by directly incorporating the concept of standard deviation and Z-scores into the analysis.
Open-source script
In true TradingView spirit, the creator of this script has made it open-source, so that traders can review and verify its functionality. Kudos to the author! While you can use it for free, remember that republishing the code is subject to our House Rules.
Disclaimer
The information and publications are not meant to be, and do not constitute, financial, investment, trading, or other types of advice or recommendations supplied or endorsed by TradingView. Read more in the Terms of Use.