OPEN-SOURCE SCRIPT
Previous Highs & Lows (Customizable)
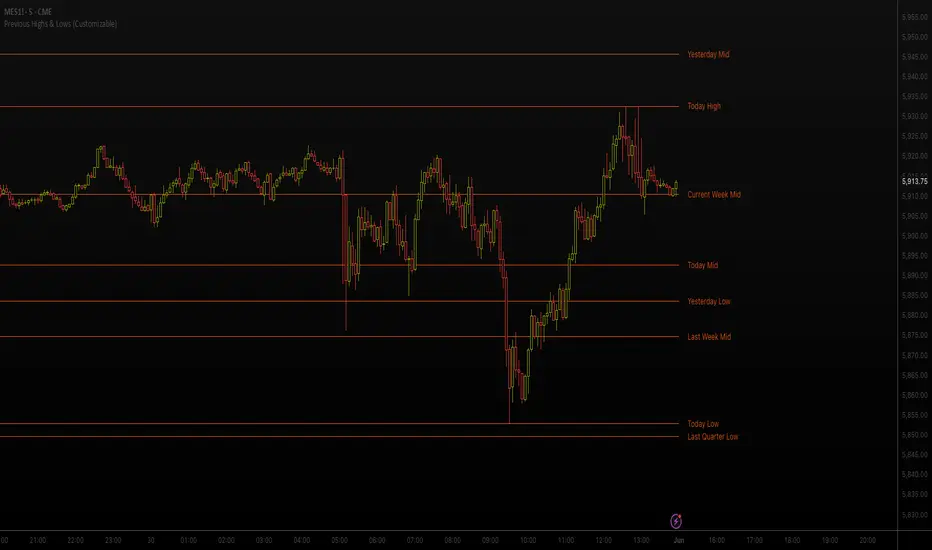
Previous Highs & Lows (Customizable)
This Pine Script indicator displays horizontal lines and labels for high, low, and midpoint levels across multiple timeframes. The indicator plots levels from the following periods:
Today's session high, low, and midpoint
Yesterday's high, low, and midpoint
Current week's high, low, and midpoint
Last week's high, low, and midpoint
Last month's high, low, and midpoint
Last quarter's high, low, and midpoint
Last year's high, low, and midpoint
Features
Individual Controls: Each timeframe has separate toggles for showing/hiding high/low levels and midpoint levels.
Custom Colors: Independent color selection for lines and labels for each timeframe group.
Display Options:
Adjustable line width (1-5 pixels)
Variable label text size (tiny, small, normal, large, huge)
Configurable label offset positioning
Organization: Settings are grouped by timeframe in a logical sequence from most recent (today) to least recent (last year).
Display Logic: Lines span the current trading day only. Labels are positioned to the right of the price action. The indicator automatically removes previous drawings to prevent chart clutter.
Open-source script
In true TradingView spirit, the creator of this script has made it open-source, so that traders can review and verify its functionality. Kudos to the author! While you can use it for free, remember that republishing the code is subject to our House Rules.
Wanna buy me a coffee or need a script? Hit me up here: buymeacoffee.com/jvye
Disclaimer
The information and publications are not meant to be, and do not constitute, financial, investment, trading, or other types of advice or recommendations supplied or endorsed by TradingView. Read more in the Terms of Use.