OPEN-SOURCE SCRIPT
Drawing tool
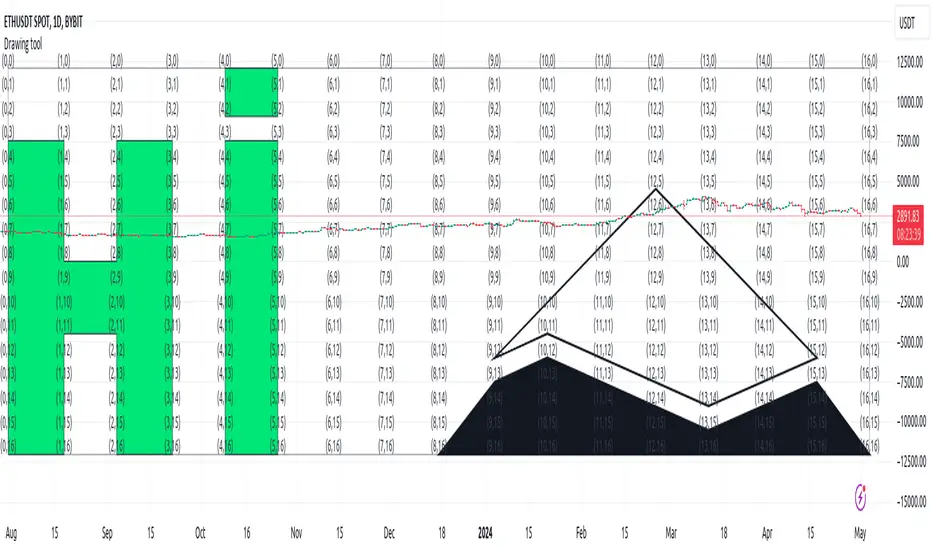
This indicator is a simple drawing tool without changing the code!
You need:
1. activate the display of coordinates (Show coordinate input)
You will see a 17 by 17 table with indexes of intersection points, in the format: (x,y)
2. activate the Enable custom drawing input
3. enter the sequence of points that you want to connect into the Coordinate for drawing input in the format: (x,y);(x,y)....
4. select line color and fill color
5. if necessary, activate Curved and Closed
In addition, you can look at some examples
Open-source script
In true TradingView spirit, the creator of this script has made it open-source, so that traders can review and verify its functionality. Kudos to the author! While you can use it for free, remember that republishing the code is subject to our House Rules.
Disclaimer
The information and publications are not meant to be, and do not constitute, financial, investment, trading, or other types of advice or recommendations supplied or endorsed by TradingView. Read more in the Terms of Use.