OPEN-SOURCE SCRIPT
Comprehensive Bands
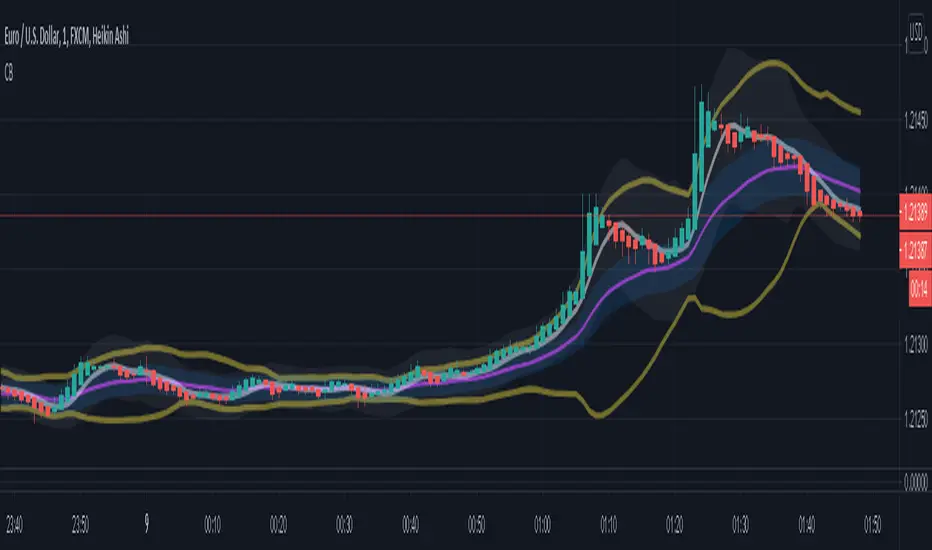
Comprehensive Bands is an unabashed mashup combining Bollinger Bands, STARC Bands, and Keltner Channels. STARC Bands are modified Keltner Channels whichdo a better job than the Bollinger Bands when it comes to showing where the top and bottom ranges of natural volatility exist. The pale white exterior cloud is your STARC Band fill. The white line is the STARC basis line. Next closest to the center we have the Bollinger Bands in yellow without a basis line (because BB basis lines aren't that great). Bollinger Bands will help to highlight when volatility breakouts are about to happen. Keltner Channels are based on an exponential moving average represented by the purple basis line in the center usually accompanied by a pair of channel lines above and below, in this case represented as a blue fill.
Every component of this indicator can represent support and resistance on the go. You can use this as a trading system. The method in this case would be similar to the Bollinger Band trading method. The Bollinger Band method involves waiting for price to hit a support or resistance line where it then prints a reversal candle, and to trade in the direction of that reversal. This indicator can improve the Bollinger Band trading method by providing a better idea of when a trend has reached a reversal point through the use of superior maximum/minimum representations and superior basis lines. All this while configured in a visual representation that's light on noise. I'd suggest using this indicator in conjunction with an oscillator you feel comfortable with such as the MacD or RSI. Happy hunting.
Shoutout to LazyBear.
Note: I'm aware that this does not contain Donchian channels and have no regrets.
Open-source script
In true TradingView spirit, the creator of this script has made it open-source, so that traders can review and verify its functionality. Kudos to the author! While you can use it for free, remember that republishing the code is subject to our House Rules.
Disclaimer
The information and publications are not meant to be, and do not constitute, financial, investment, trading, or other types of advice or recommendations supplied or endorsed by TradingView. Read more in the Terms of Use.