OPEN-SOURCE SCRIPT
Updated Super Cycle Low Finder
How the Indicator Works
1. Inputs
Users can adjust the cycle lengths:
Daily Cycle: Default is 40 days (within 36-44 days).
Weekly Cycle: Default is 26 weeks (182 days, within 22-31 weeks).
Yearly Cycle: Default is 4 years (1460 days).
2. Cycle Low Detection
Function: detect_cycle_low finds the lowest low over the specified period and confirms it with a bullish candle (close > open).
Timeframes: Daily lows are calculated directly; weekly and yearly lows use request.security to fetch data from higher timeframes.
3. Half Cycle Lows
Detected over half the cycle length, plotted to show mid-cycle strength or weakness.
4. Cycle Translation
Logic: Compares the position of the highest high to the cycle’s midpoint.
Output: "R" for right translated (bullish), "L" for left translated (bearish), displayed above bars.
5. Cycle Failure
Flags when a new low falls below the previous cycle low, indicating a breakdown.
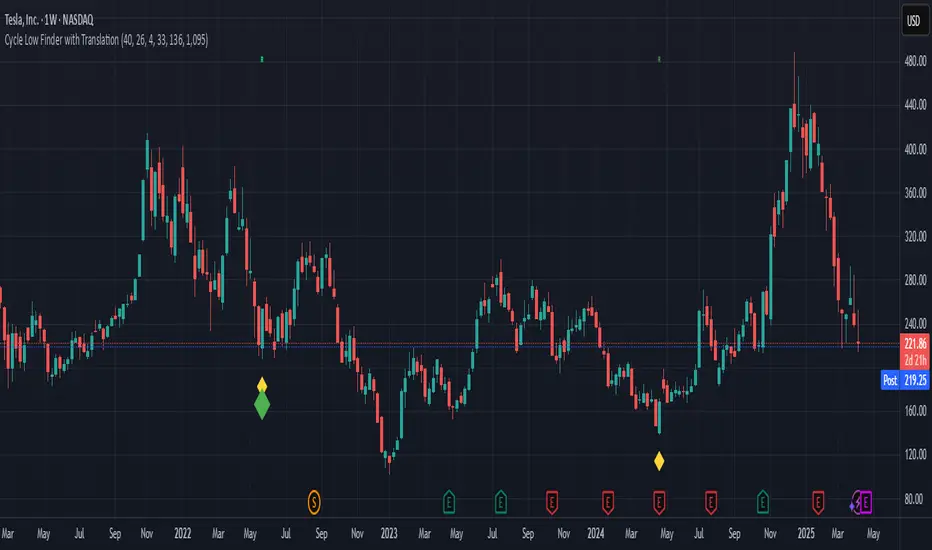
6. Visualization
Cycle Lows: Diamonds below bars (yellow for daily, green for weekly, blue for yearly).
Half Cycle Lows: Circles below bars (orange, lime, aqua).
Translations: "R" or "L" above bars in distinct colors.
Failures: Downward triangles below bars (red, orange, purple).
1. Inputs
Users can adjust the cycle lengths:
Daily Cycle: Default is 40 days (within 36-44 days).
Weekly Cycle: Default is 26 weeks (182 days, within 22-31 weeks).
Yearly Cycle: Default is 4 years (1460 days).
2. Cycle Low Detection
Function: detect_cycle_low finds the lowest low over the specified period and confirms it with a bullish candle (close > open).
Timeframes: Daily lows are calculated directly; weekly and yearly lows use request.security to fetch data from higher timeframes.
3. Half Cycle Lows
Detected over half the cycle length, plotted to show mid-cycle strength or weakness.
4. Cycle Translation
Logic: Compares the position of the highest high to the cycle’s midpoint.
Output: "R" for right translated (bullish), "L" for left translated (bearish), displayed above bars.
5. Cycle Failure
Flags when a new low falls below the previous cycle low, indicating a breakdown.
6. Visualization
Cycle Lows: Diamonds below bars (yellow for daily, green for weekly, blue for yearly).
Half Cycle Lows: Circles below bars (orange, lime, aqua).
Translations: "R" or "L" above bars in distinct colors.
Failures: Downward triangles below bars (red, orange, purple).
Release Notes
How the Indicator Works1. Inputs
Users can adjust the cycle lengths:
Daily Cycle: Default is 40 days (within 36-44 days).
Weekly Cycle: Default is 26 weeks (182 days, within 22-31 weeks).
Yearly Cycle: Default is 4 years (1460 days).
2. Cycle Low Detection
Function: detect_cycle_low finds the lowest low over the specified period and confirms it with a bullish candle (close > open).
Timeframes: Daily lows are calculated directly; weekly and yearly lows use request.security to fetch data from higher timeframes.
3. Half Cycle Lows
Detected over half the cycle length, plotted to show mid-cycle strength or weakness.
4. Cycle Translation
Logic: Compares the position of the highest high to the cycle’s midpoint.
Output: "R" for right translated (bullish), "L" for left translated (bearish), displayed above bars.
5. Cycle Failure
Flags when a new low falls below the previous cycle low, indicating a breakdown.
6. Visualization
Cycle Lows: Diamonds below bars (yellow for daily, green for weekly, blue for yearly).
Half Cycle Lows: Circles below bars (orange, lime, aqua).
Translations: "R" or "L" above bars in distinct colors.
Failures: Downward triangles below bars (red, orange, purple).
Release Notes
How Cycle Translation Works in the IndicatorKey Logic
Cycle Midpoint: For each cycle (e.g., 40 days for daily), the midpoint is calculated as half the cycle length (e.g., 20 days).
Cycle High: The highest high between two consecutive cycle lows is identified.
Translation Determination:
Right Translated (RT): If the cycle high occurs after the midpoint (fewer bars since the high than the midpoint), it’s bullish.
Left Translated (LT): If the cycle high occurs before the midpoint (more bars since the high than the midpoint), it’s bearish.
Release Notes
bugs fixedRelease Notes
fixedRelease Notes
updateOpen-source script
In true TradingView spirit, the creator of this script has made it open-source, so that traders can review and verify its functionality. Kudos to the author! While you can use it for free, remember that republishing the code is subject to our House Rules.
Disclaimer
The information and publications are not meant to be, and do not constitute, financial, investment, trading, or other types of advice or recommendations supplied or endorsed by TradingView. Read more in the Terms of Use.
Open-source script
In true TradingView spirit, the creator of this script has made it open-source, so that traders can review and verify its functionality. Kudos to the author! While you can use it for free, remember that republishing the code is subject to our House Rules.
Disclaimer
The information and publications are not meant to be, and do not constitute, financial, investment, trading, or other types of advice or recommendations supplied or endorsed by TradingView. Read more in the Terms of Use.