OPEN-SOURCE SCRIPT
Updated Wave Chart v1
##Wave Chart v1##
For analyzing Neo-wave theory
Plot the market's highs and lows in real-time order.
Then connect the highs and lows
with a diagonal line. Next, the last plot of one day (or bar) is connected with a straight line to the
first plot of the next day (or bar).
##How To Use##
if you want a weekly chart you drop the time frame to the daily chart.
Then you set the range to 7(if the market opens 7 days per week).
Then you click "highlight the bar that runs to plot" and you must shift the highlight to the last day that the weekly chart bar close(Sunday / Friday)
##Example 1
Weekly chart BTCUSDT on BINANCE
first open daily chart, set range = 7 and Bars_shift = 3 (shift highlight to Sunday)
##Example 2
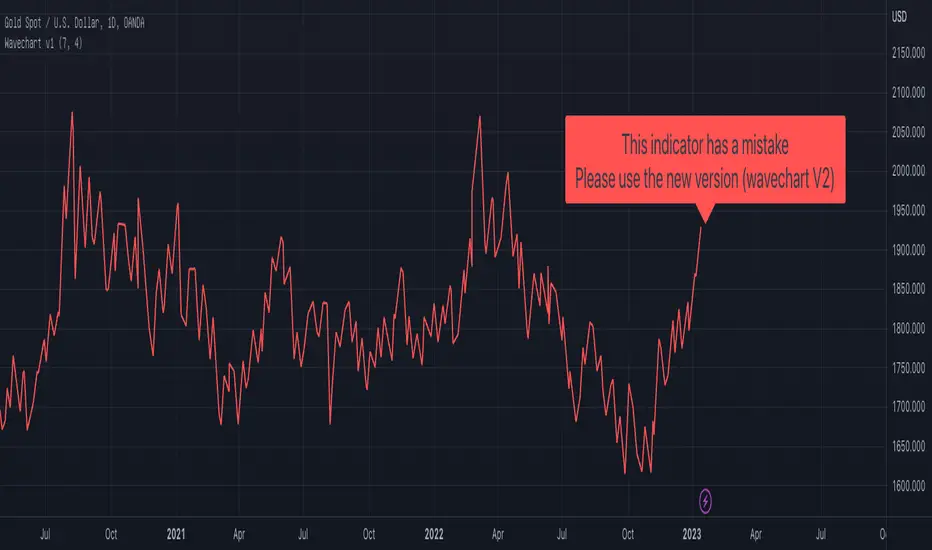
Weekly chart XAUUSD on FXOPEN
first open daily chart, set range = 5 (market open 5 days per week) and Bars_shift = 1 (shift highlight to Friday)
##Note##
If the market has a special holiday Wave Chart may be inaccurate.
For analyzing Neo-wave theory
Plot the market's highs and lows in real-time order.
Then connect the highs and lows
with a diagonal line. Next, the last plot of one day (or bar) is connected with a straight line to the
first plot of the next day (or bar).
##How To Use##
if you want a weekly chart you drop the time frame to the daily chart.
Then you set the range to 7(if the market opens 7 days per week).
Then you click "highlight the bar that runs to plot" and you must shift the highlight to the last day that the weekly chart bar close(Sunday / Friday)
##Example 1
Weekly chart BTCUSDT on BINANCE
first open daily chart, set range = 7 and Bars_shift = 3 (shift highlight to Sunday)
##Example 2
Weekly chart XAUUSD on FXOPEN
first open daily chart, set range = 5 (market open 5 days per week) and Bars_shift = 1 (shift highlight to Friday)
##Note##
If the market has a special holiday Wave Chart may be inaccurate.
Release Notes
This indicator has a mistakeThe distances between the high value point and the low value point on the Neowave chart should be equal.
Please use the new version (wavechart V2)
Open-source script
In true TradingView spirit, the creator of this script has made it open-source, so that traders can review and verify its functionality. Kudos to the author! While you can use it for free, remember that republishing the code is subject to our House Rules.
Disclaimer
The information and publications are not meant to be, and do not constitute, financial, investment, trading, or other types of advice or recommendations supplied or endorsed by TradingView. Read more in the Terms of Use.